Research
Election turnout in Jersey
1. Introduction
Civic engagement is often assessed by reference to turnout in elections. Election turnout in Jersey has averaged 44% over the last 30 years, one of the lowest figures in the world. The Jersey Better Life Index 2023 stated that “Voter turnout in Jersey (41.6% in the June 2022 States Assembly Deputy elections) was lower than in all OECD member and partner countries. Across the OECD the latest average voter turnout rate is 70%”.
The low turnout largely reflects an unwillingness to vote because of attitudes to the Jersey political system. This report sets out and analyses the available data on turnout and attitudes to voting and then considers possible measures to increase turnout.
2. Summary
Election turnout figures, calculated by dividing the number of votes cast by the number of registered voters, are generally presented as a single percentage. This figure can be misleading, particularly because of practice in respect of recording the size of the electorate. Policies designed to increase the size of the electorate can have the effect of lowering turnout.
Turnout in Jersey elections over the last 30 years has averaged 44.1%. There has been significant variation from a low of 39.9% in 2014 to a high of 50.4% in 1993. The 1993 figure is an outlier, the next highest figure being 46.7% in 2002. There is no clear trend in the turnout figures - turnout in the 2022 election at 41.7% was the third lowest over the last 30 years.
Until 2011, from when elections for senators and deputies were held on the same day, turnout for the senator elections was significantly higher - by 2.4 percentage points in St Mary, 2.1 percentage points in St Helier and 8.8 percentage points in St Clement.
In the 2022 election, turnout was much higher in the 65+ age group (53%) than in the under 35 age group (17%), in rural areas (40%) than in urban areas (18%), and among owner-occupiers (41%) than among tenants (16%).
Turnout in Jersey elections is lower than in all the OECD countries. Switzerland, at 47%, is the only country with a figure below 60%. Turnout in the last UK General Election was 59.7% and in the Isle of Man, 50.7%. Turnout in the 2025 Guernsey election was 72.1%, much higher than the Jersey figure of 41.7%, although this is partly explained by Guernsey’s electoral registration system, which results in a relatively low proportion of those eligible to vote registering to do so.
Compared with the UK, turnout in Jersey is more heavily concentrated among the elderly and owner-occupiers. In the 65+ age group, turnout in Jersey was 53%, compared to 73% in the UK. The variation in the 16-34 age group was much wider - 17% as against 39%. Similarly, tenants are twice as likely to vote in the UK than in Jersey.
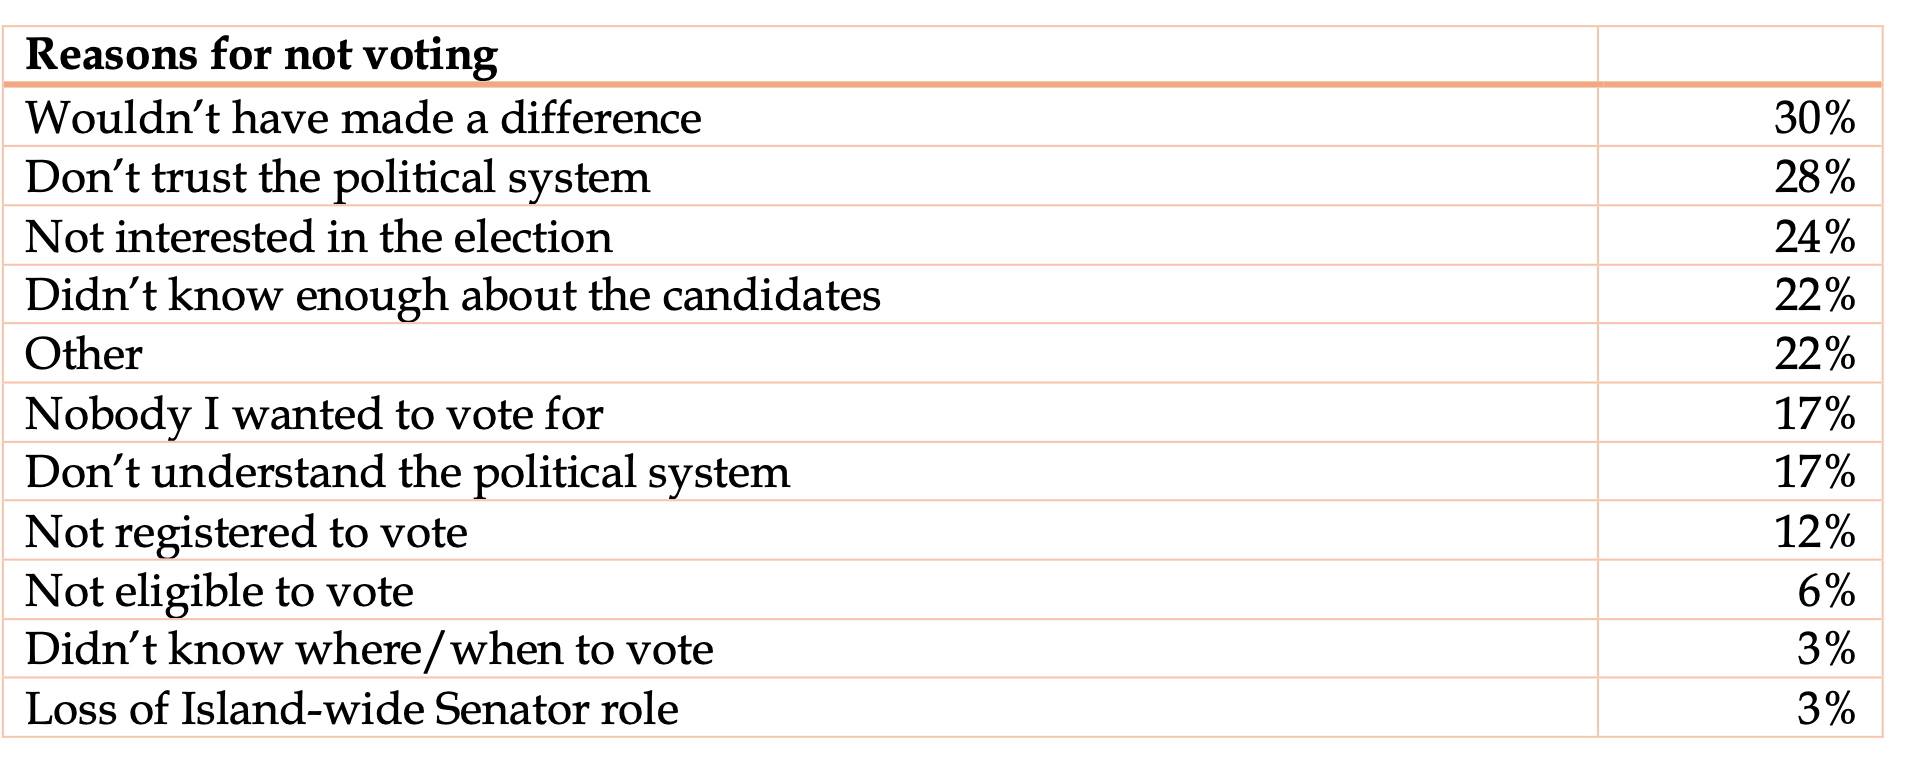
Opinion surveys suggest that the reasons for the low turnout are mainly general negative attitudes towards the political system in Jersey. The main reasons given for people not voting in the 2022 election were –
Wouldn’t have made a difference 30%
Don’t trust the political system 28%
Not interested in the election 24%
Didn’t know enough about the candidates 22%
The “Didn’t know where or how to vote” and “Loss of the Island-wide Senator role” options recorded only 3% each.
Voter registration is low in Jersey. For the 2022 election, 75% of those eligible to vote registered, so 31% of those eligible to vote actually voted. The voter registration proportion is ten percentage points below the UK figure. There were significant variations between the parishes, with much higher figures in the country parishes. In St Mary, 96% of those entitled to vote registered and the turnout was 52%, so half of those entitled to vote did so. However, in St Helier Central, as only 57% of those entitled to vote registered and there was a 29% turnout, so only 17% of those entitled to vote did so.
The arrangements for voter registration differ to some extent between parishes and are not well developed compared with other jurisdictions. Similarly, the process for removing people from the electoral register is not very sophisticated. It is notable that when people use the government form to notify a change of address, this information is not provided to parishes to amend their registers. It is probable that a significant proportion of voters on the register should not be, which in turn depresses the turnout figure.
There are three significant changes relevant to voter turnout in the arrangements for the 2026 election: the election day will be a Sunday, automatic registration of electors is being introduced and the position of senator, elected on an island-wide basis, has been reintroduced. An opinion survey by Statistics Jersey suggests that turnout will remain low, although perhaps with younger people and tenants being more likely to vote than in 2022.
Within the present electoral arrangements, voter turnout can best be increased by -
- Increasing postal voting – principally by providing an option for postal voting in voter registration forms.
- Simplifying the voter registration form, in particular by removing unnecessary wording on data protection and giving a single return point.
- Increasing the number of polling stations to ensure consistent coverage.
- Introducing one or more super polling stations (as in Guernsey) at which any elector can cast their votes on election day.
- Better sharing of information between election officials, and the use of other data such as social security and tax records.
Simplifying residence requirements to a single test would both simplify voter registration and remove discrimination. Longer term, Jersey should consider having a single electoral office and a single register, centrally maintained, using standard electoral software. Best practice from the UK Electoral Commission and other organisations could usefully be drawn on.
Revising Jersey’s electoral arrangements is capable of having only a limited impact. Turnout will remain low as long as the fundamental issue of distrust in the political system remains.
3. Conceptual issues
Election turnout is generally presented as a single figure which gives a spurious impression of accuracy. If turnout is 60% then the assumption is that 60% of those eligible to vote voted and 40% did not. The reality is more complicated. While the figure for those who voted can be taken as accurate the figure for those eligible to vote is in a different category. It is generally taken to be those on the electoral roll, though this figure depends on two factors –
- The procedure for getting on the electoral roll, which in some jurisdictions (including some American states) is deliberately designed to exclude some categories of people. Restrictions can include residence requirements, the need to show identity documents, and verification procedures. Even where there are no such measures registration can never be fully effective as long as it remains voluntary.
- The procedure for removing people from the electoral roll, because of death or moving home.
Any country that is a democracy should aim to ensure that the maximum number of eligible people are registered as electors, but it needs to be recognised that the more that “reluctant voters” are registered the lower that turnout is likely to be as people reluctant to register are likely to be reluctant to vote. This also applies also to extending the franchise to younger groups – as they are less likely to vote than older people.
Election canvassers are well aware that many people on the electoral register are not at the address at which they are registered. This may be because they have moved home or have died. Typically, if there is no evidence that they are no longer at the address and if they do not respond to the annual canvass, people are left on the register for two or three years. This is done with the admirable intention of not disenfranchising people who may simply have forgotten to reregister. However, the more liberal the approach to keeping people on the register, the higher the number of people who cannot or will not vote and therefore the lower turnout is. For this reason, it is helpful to compare the size of the electorate with a variable such as the size of the population over voting age.
These points can usefully be demonstrated by looking at key statistics for Jersey –
Population as at April 2021 103,267
Population over 16 as at April 2021 86,791
JEA estimate of eligible voters 81,000
Registered voters 60,701
Voters 25,334
Registered voters/population over 16 69.9%
Registered voters/eligible voters 75%
Voters/registered voters 41.7%
Voters/population over 16 29.2%
Voters/eligible voters 31.3%
The Jersey Electoral Authority (JEA) estimated that 75% of those entitled to vote registered to do so, so turnout when measured against eligible voters was 31.3% rather than the published turnout figure of 41.7%. This needs to be qualified because an unknown number of registered voters were either not able to vote, because they had died, or not likely to vote, because they had moved home.
4. Trends in turnout in Jersey elections
It is difficult to analyse trends in turnout in Jersey elections because the data are inadequate, both in respect of coverage and consistency. This was explained in the response to a Freedom of Information request in 2016 -
The numbers of votes cast for each candidate in elections from 1945 were not centrally collected in a structured form such as a spreadsheet or database until relatively recently. The data which we do maintain in such a form goes back to 1990 for election of both deputies and senators.
The data is not easy to find on the JEA website but rather has to be accessed from this page . For periods before 1990 those seeking data are referred to the reports of election results in the Jersey Evening Post.This section draws on the data in the JEA website, although much of this data is itself taken from Jersey Evening Post reports rather than the actual records.
Analysing trends in turnout is also difficult because many elections have been uncontested. The most consistent series is that for elections for senators as these were always contested. Table 1 shows turnout in Jersey elections since 1990. The 2022 figures are for the elections for deputy as there were no senatorial elections and all the constituencies for deputy were contested.
Table 1 Turnout in Jersey elections, 1990-2022
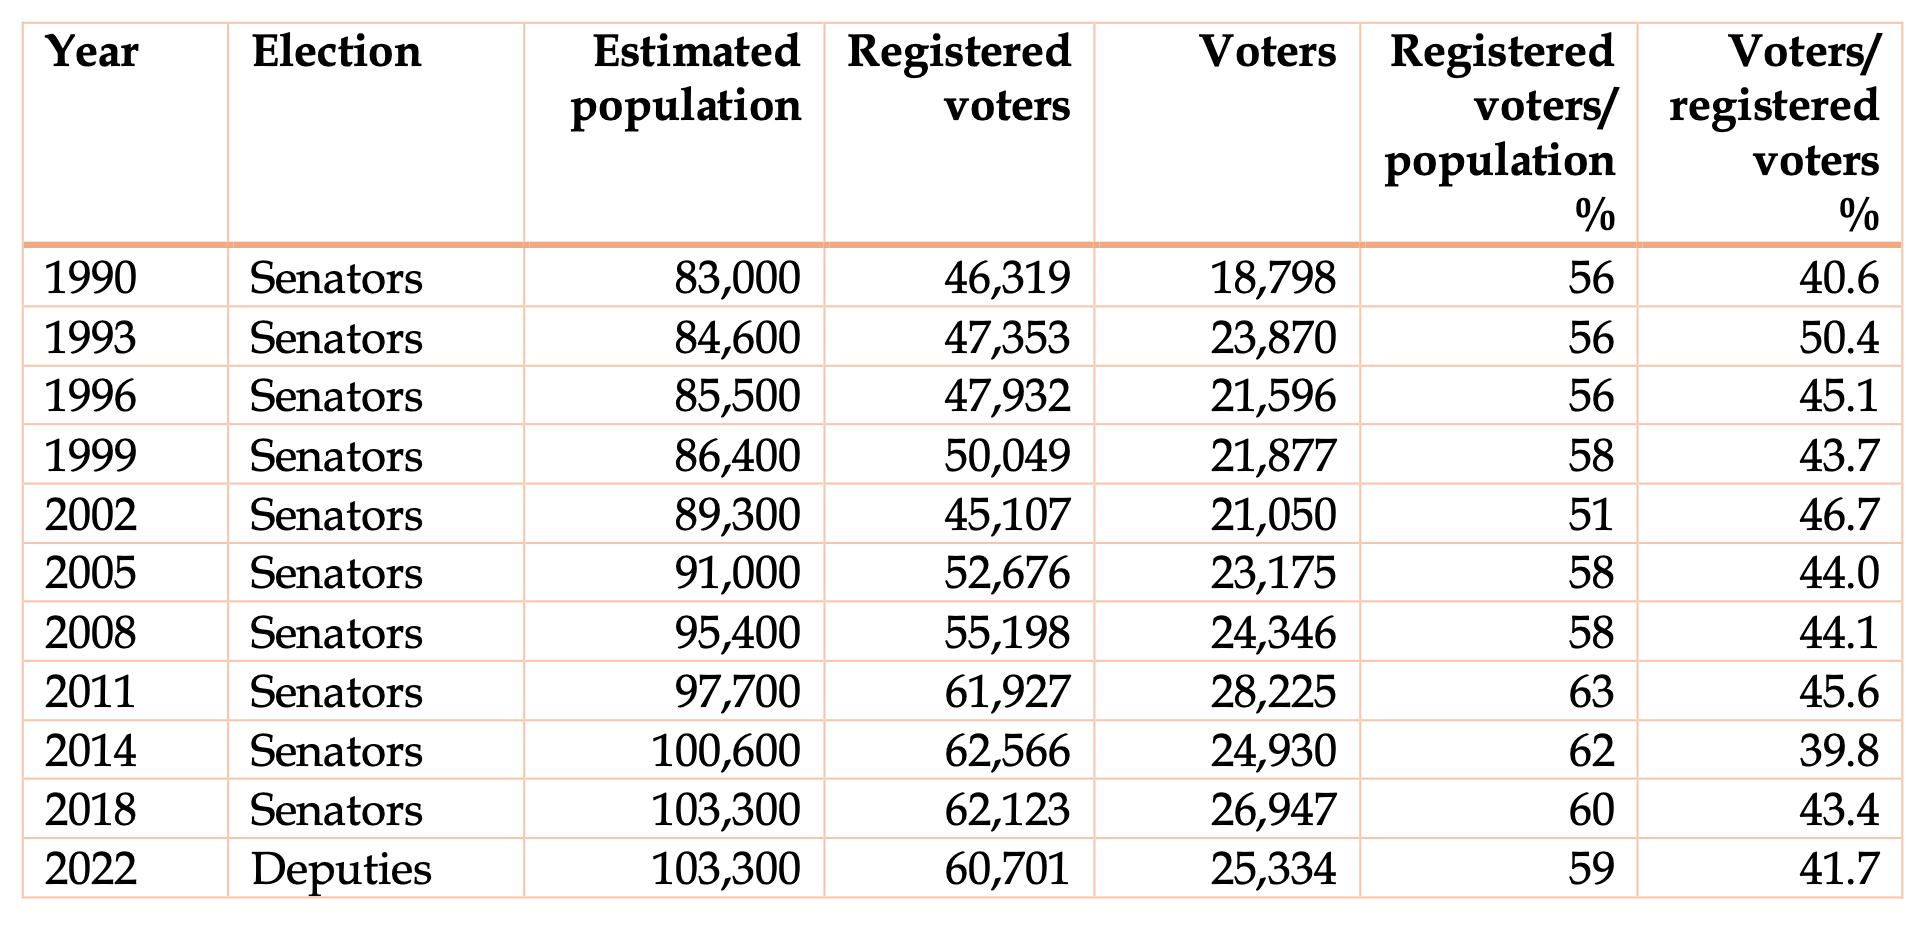
Note: The population figures are for the end of the years.
The average turnout in the 11 elections was 44.1%. There is a significant variation from a low of 39.8% in 2014 to a high of 50.4% in 1993. The 1993 figure is an outlier, the next highest figure being 46.7%. There is no clear trend in the turnout figures.
There is also no clear trend in the number of registered voters in relation to the total population – a reasonable proxy for the proportion of those eligible to vote who register to do so. However, it should be noted that from the 2008 election, the voting age was reduced to 16 which, in itself, should increase the proportion of registered voters to population by about three percentage points. This may help to explain the significant increase of five percentage points in the registered voters/population ratio between 2008 and 2011.
Something strange happened in 2002, when the number of registered voters was nearly 5,000 fewer than in 1999, notwithstanding an increase in population of 3,000. There was therefore the paradox of fewer people voting than in 1999 but turnout increasing by three percentage points. This illustrates the point made in the previous section – that the lower the voter registration, the higher the turnout. 2002 should be regarded as an aberration; in reality, turnout as a proportion of eligible voters fell compared with 1999.
While it is not possible to analyse trends in elections for deputies closely because so many elections have been uncontested, it is useful to analyse what information is available and also to compare trends in elections for deputies with those for senators. Table 2 shows the data for three parishes: St Helier, by far the largest, St Mary, the smallest, and St Clement, the latter being representative of the three “suburban” parishes (St Clement, St Saviour and St Brelade).
Table 2 Turnout in Jersey elections, selected parishes, 1990-2014
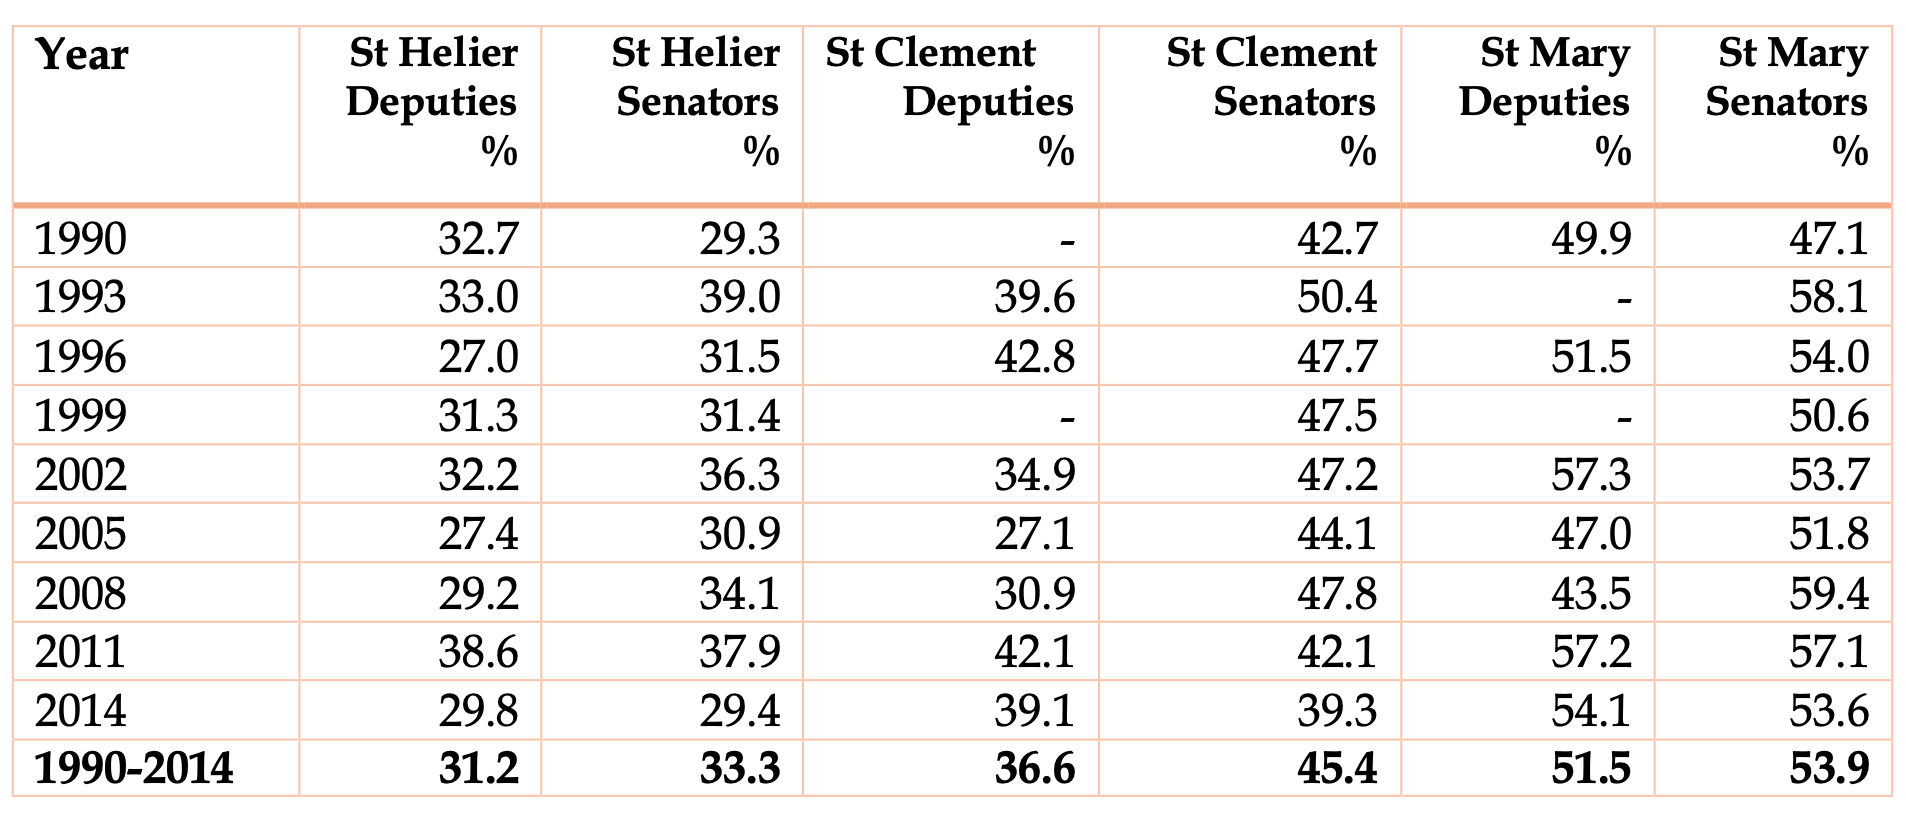
The table shows significantly higher turnout in St Mary, representative of the country parishes, than in St Clement which in turn has much higher figures than St Helier. Until the 2011 election, elections for senators were held separately from those for deputies. In that year and the 2014 election, turnout was very similar in the senator and deputy elections. However, prior to that, when the elections were on different days, turnout in the elections for senators was significantly higher than for deputies - by 2.4 percentage points in St Mary, 2.1 percentage points in St Helier and 8.8 percentage points in St Clement.
5. Turnout in the 2022 Jersey election
The only official breakdown of turnout in the 2022 election is by parish. Table 3 shows the statistics for the elections for constables.
Table 3 Turnout by parish, Jersey 2022 constables’ election
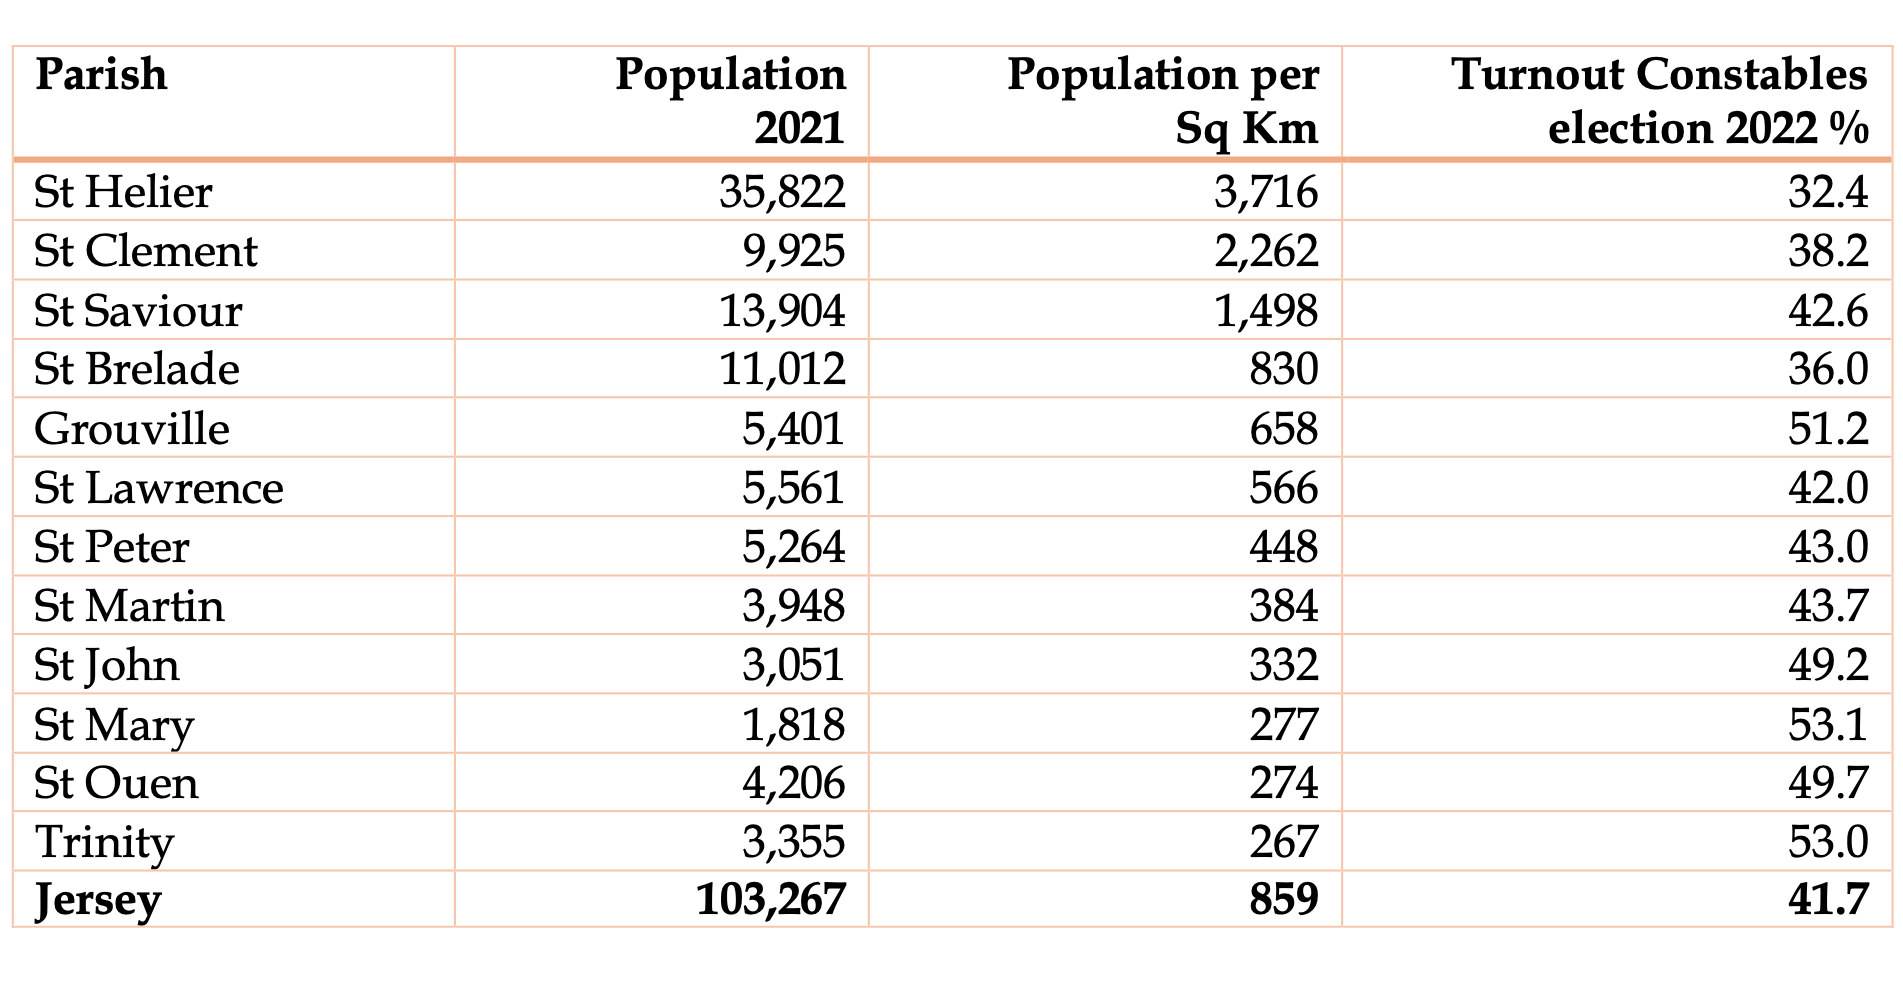
Notes:
1. The population and population density figure are from Table A3 of the Report on the Jersey Census 2022.
2. The turnout figures are from the vote.je website. This gives no figure for the St Saviour election; the percentage for St Saviour is that for the election for deputies.
It will be seen that turnout varied from 32.4% in St Helier to 53.1% in St Mary. The other country parishes of St John, St Ouen and Trinity recorded turnout of between 49.2% and 53.0%. Generally, there is a negative correlation between turnout and population density, although Grouville stands out as an exception with comparatively high turnout at 51.2% despite having the fifth highest density of population. This may be explained by a very competitive election for the role of constable. The Jersey Opinions and Lifestyle Survey estimated that turnout averaged 18% in urban areas, 33% in suburban areas and 40% in rural areas.
Turnout can be analysed further through surveys which ask people if they voted. The resultant figures are only indicative because they are based on surveys.
Statistics Jersey conducts an annual Jersey Opinions and Lifestyle Survey (JOLS) and data are also available from a survey commissioned after the 2018 election. There are four separate surveys that give relevant information on turnout for different categories of people –
- The Jersey Opinions and Lifestyle Survey Report 2017, which asked about voting in the 2014 election – but the time lag means that the results of this particular survey must be viewed with particular caution.
- A survey commissioned by the States Assembly from ComRes immediately after the 2018 election in respect of that election.
- The Jersey Opinions and Lifestyle Survey Report 2018, which asked about voting in the 2018 election, the fieldwork being done shortly after the election.
- The Jersey Opinions and Lifestyle Survey Report 2022, which asked about voting in the 2022 election, the fieldwork being done shortly after the election.
In the JOLS surveys the results are corrected to align with the actual proportion of adults who voted, whereas the ComRes survey recorded the proportion saying that they had voted - which is always higher largely because of sample bias, but also because some people say they have voted when they did not.
Table 4 shows the data from the four surveys. There is significant variation between the surveys, and no great significance should be read into changes between them. However, there are some clear conclusions –
- Voting is strongly correlated with age – those over 64 were more than twice as likely to vote as those under 35.
- There is a similar hierarchy in respect of housing tenure, with owner-occupiers much more likely to vote than tenants.
- In respect of place of birth, the one significant point is low turnout from those born in Portugal, including Madeira.
Table 4 Turnout by population characteristic, Jersey, 2014-22
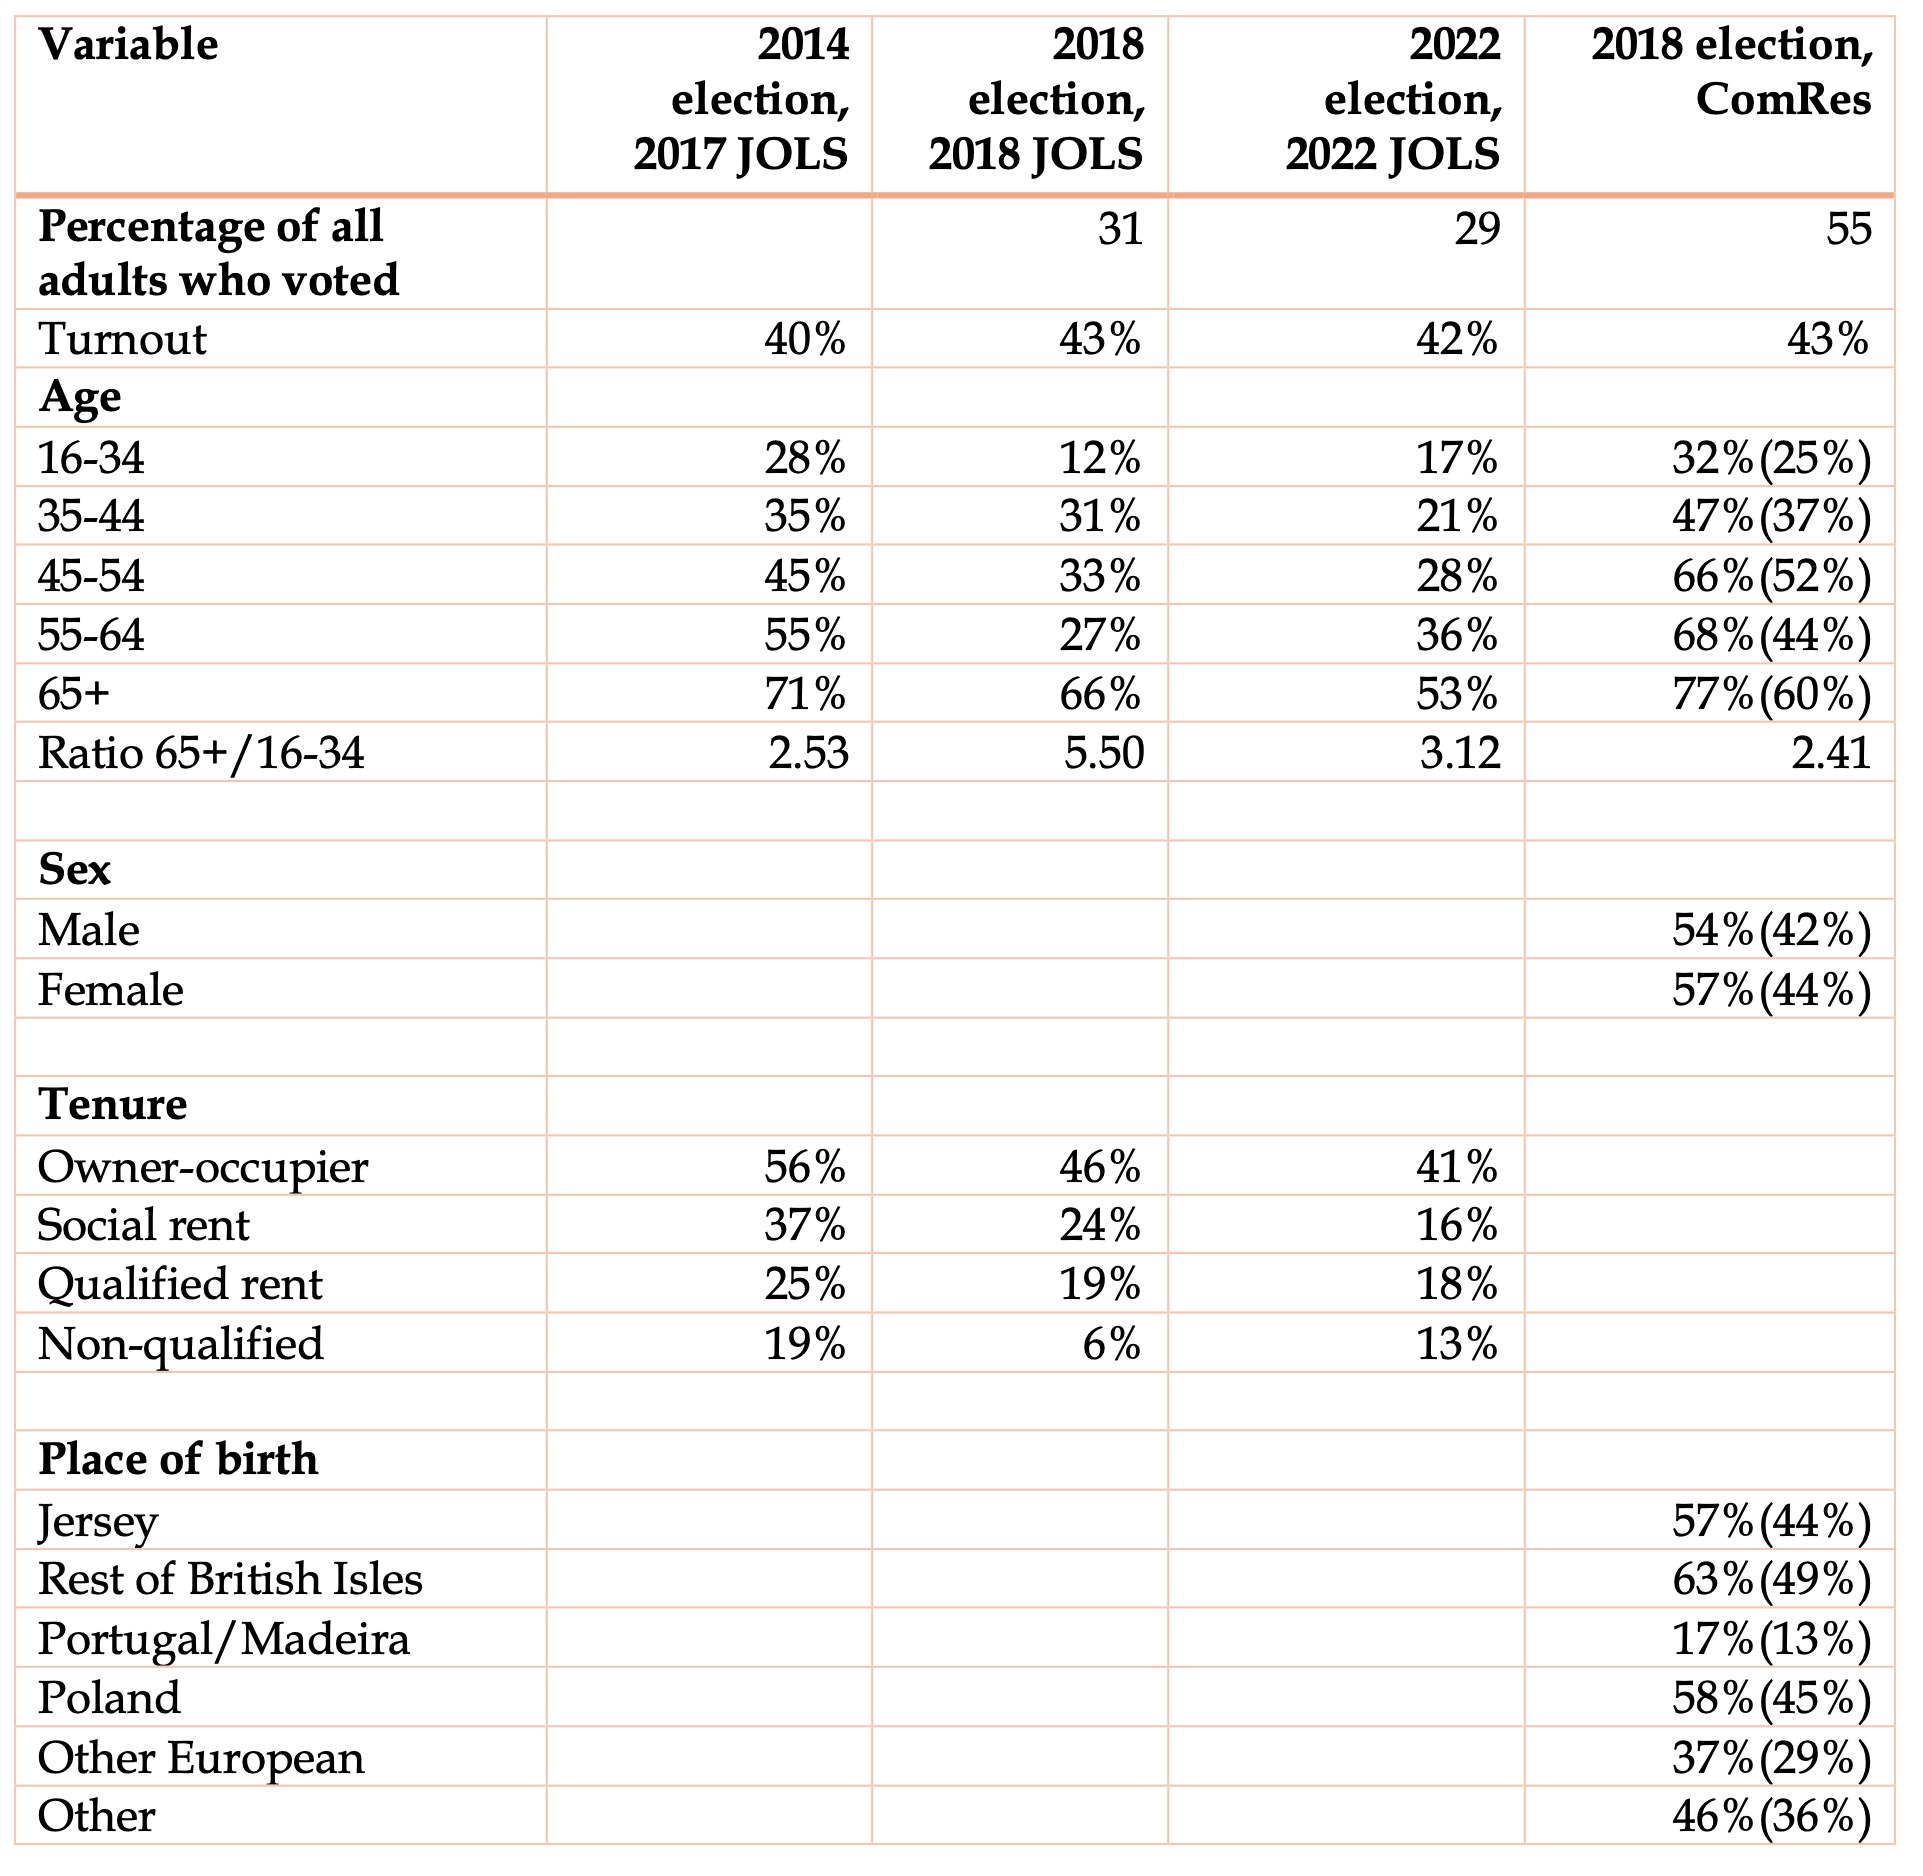
Note: The ComRes figures in brackets have been corrected to the actual turnout to be compatible with the JOLS figures.
6. Comparative data
It is helpful to compare turnout in Jersey elections with turnout in other jurisdictions. Table 5 shows relevant data.
Table 5 Election turnout, comparative figures
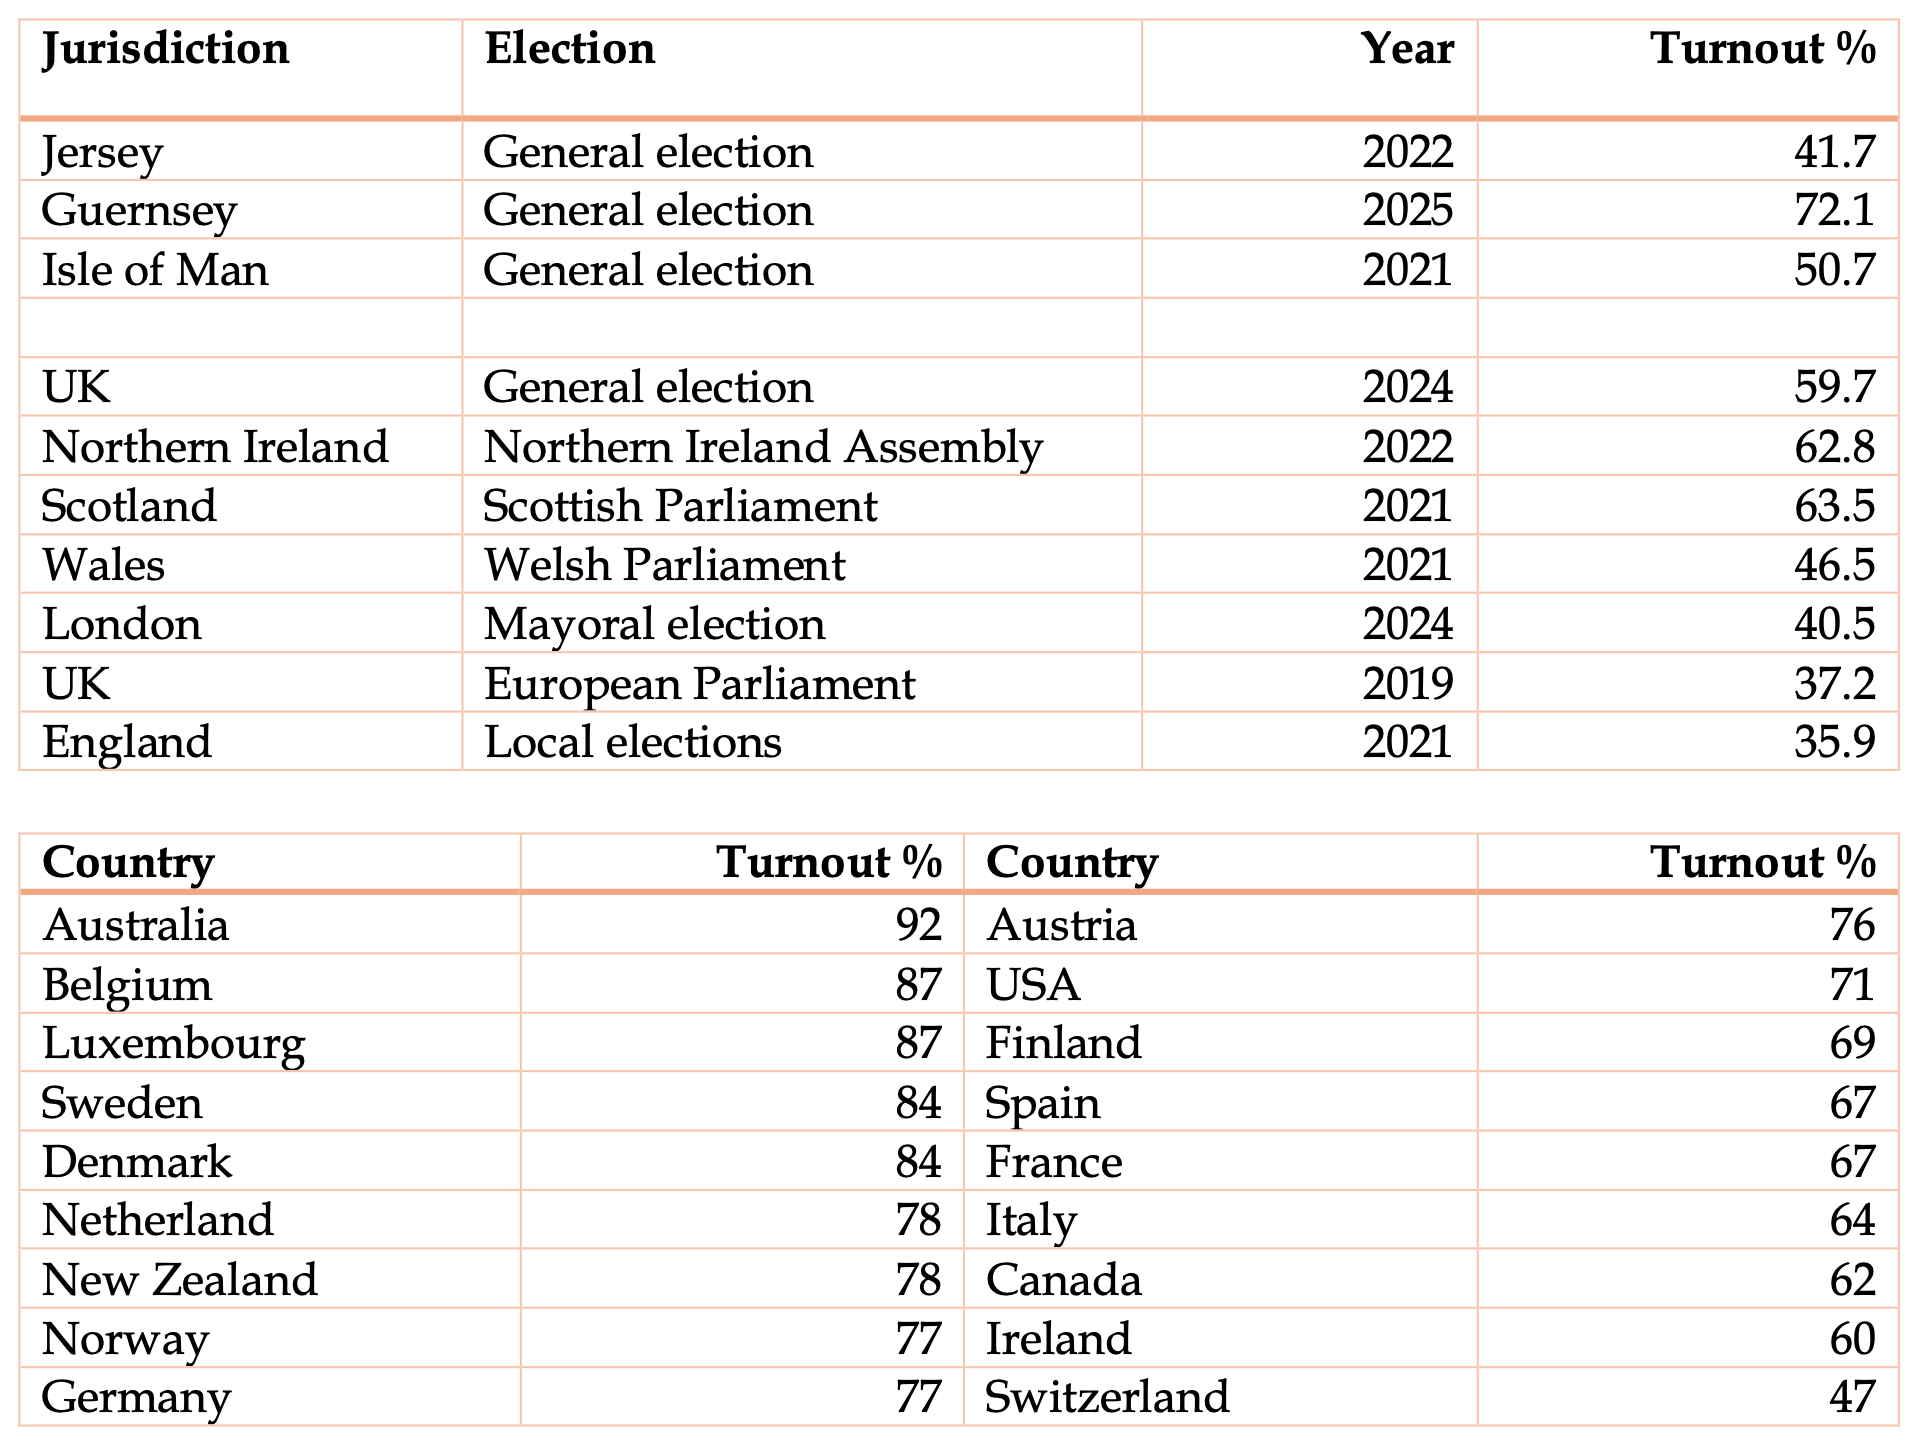
Sources: The figures for the British Isles are taken from Elise Uberoi, Turnout at elections, House of Commons Briefing paper, January 2023. (This paper provides a very detailed analysis of turnout in elections in the UK.) The figures for other countries are taken from the World population review website.
It is worth noting that turnout in the 2024 UK general election was 7.6 percentage points below turnout in the 2019 election and the lowest figure since 2001. Within the UK turnout ranged from 64.7% in the South West and 64.6% in the South East, down to 55.7% in Yorkshire & Humber and 56.2% in Wales.
The table shows a massive difference between Jersey and Guernsey – 41.7% as against 72.1%. However, this is partly explained by different practices with respect to the electoral register – explained in Appendix 1. Turnout in the last UK General Election was 59.7%, and in the Isle of Man 50.7%. However, the Jersey figures are reasonably comparable with UK regional elections.
The table shows that every country had turnout higher than Jersey. Switzerland, at 47%, was the only country with a figure below 50%.
It is useful to breakdown the turnout figures by voter characteristics. A comparison with the UK can be done using the data in the Ipsos reportHow Britain voted in the 2024 election.
Table 6 Turnout by voter characteristic, Jersey and UK
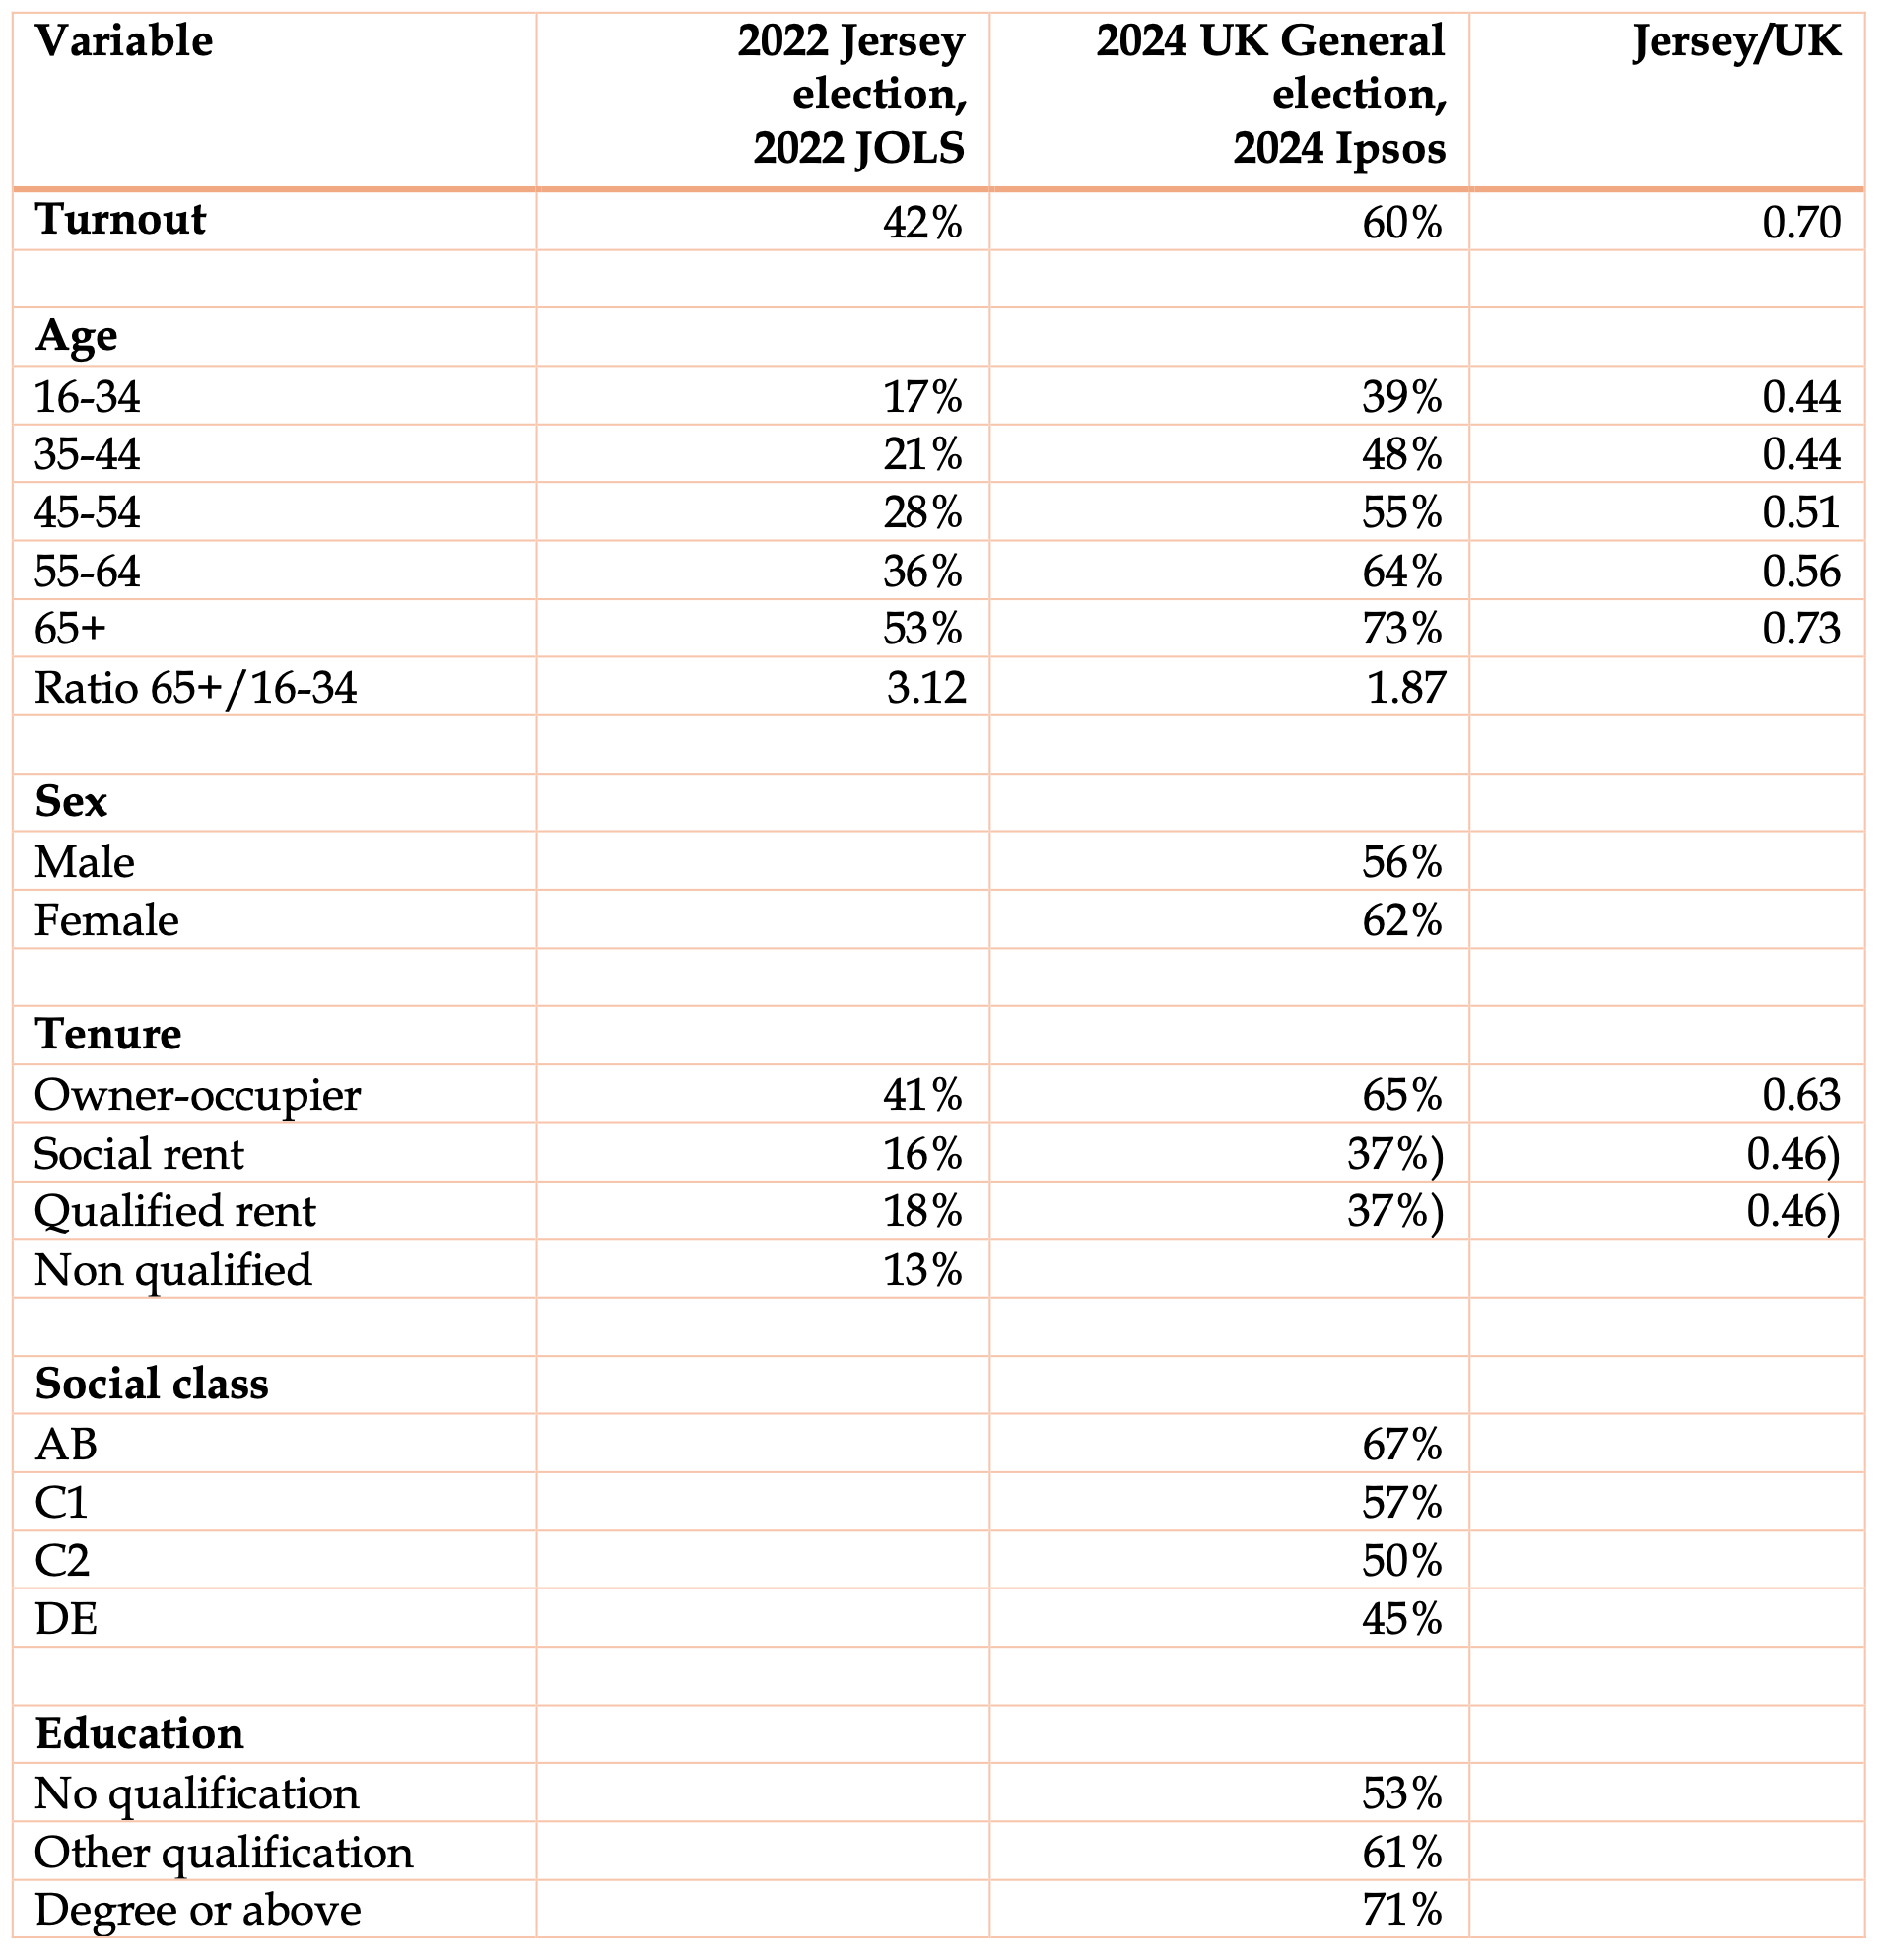
The differences in respect of voter characteristics are much greater in Jersey than in the UK. Specifically –
- In the 65+ age group Jersey turnout was 73% of the UK figure; in the 16-34 age group, it was 44%.
- For owner-occupiers Jersey turnout was 63% of the UK proportion; for renters, it was 46%.
7. Why turnout in Jersey is low
Analysing why turnout is low is a far from easy task. Survey evidence is useful – asking those who did not vote why they did not and what would make them more likely to vote. The four surveys mentioned in Section 5 provide valuable data –
- The Jersey Opinions and Lifestyle Survey Report 2017, which asked questions in respect of the 2014 election.
- The Jersey Opinions and Lifestyle Survey Report 2018, which asked questions in respect of the 2018 election.
- A survey by the market research company Comres States of Jersey Voter Engagement Survey 2018.
- The Jersey Opinions and Lifestyle Survey Report 2022, which asked questions in respect of the 2022 election.
Three points need to be noted about these surveys in particular and such surveys in general –
- They are surveys, not hard data.
- They are based on a sample and it is difficult to secure a representative sample.
- Surveys typically give a number of possible answers to each question so it is crucial what questions are asked. For example, in questions about “what would make you more likely to vote”, if the option of “polling at weekend” is given then some people will opt for it; if it not given, then it will not be recorded as a factor. It is also significant whether people are asked to give a main reason or can tick any number of reasons.
These factors mean that no one survey can be taken as definitive, but rather the results of all the surveys need to be considered together. The key data from the surveys are set out below.
Table 7 Jersey Opinions and Lifestyle Survey Report 2017
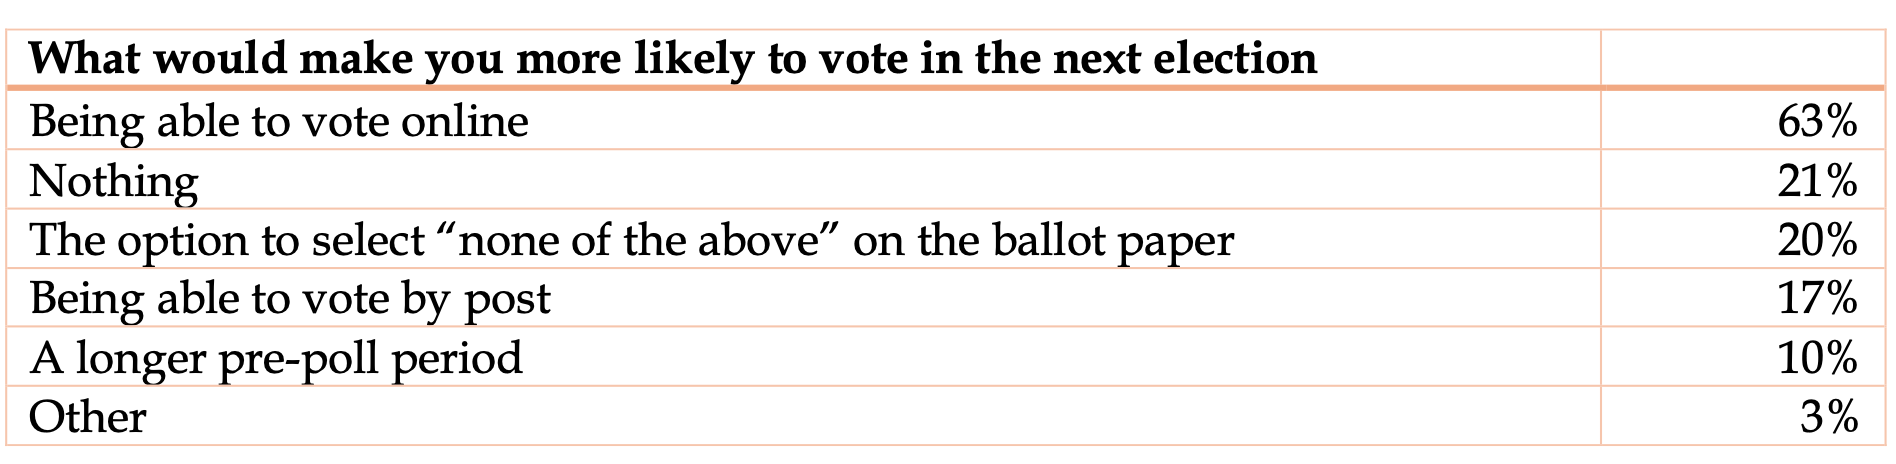
Table 8 Jersey Opinions and Lifestyle Survey Report 2018
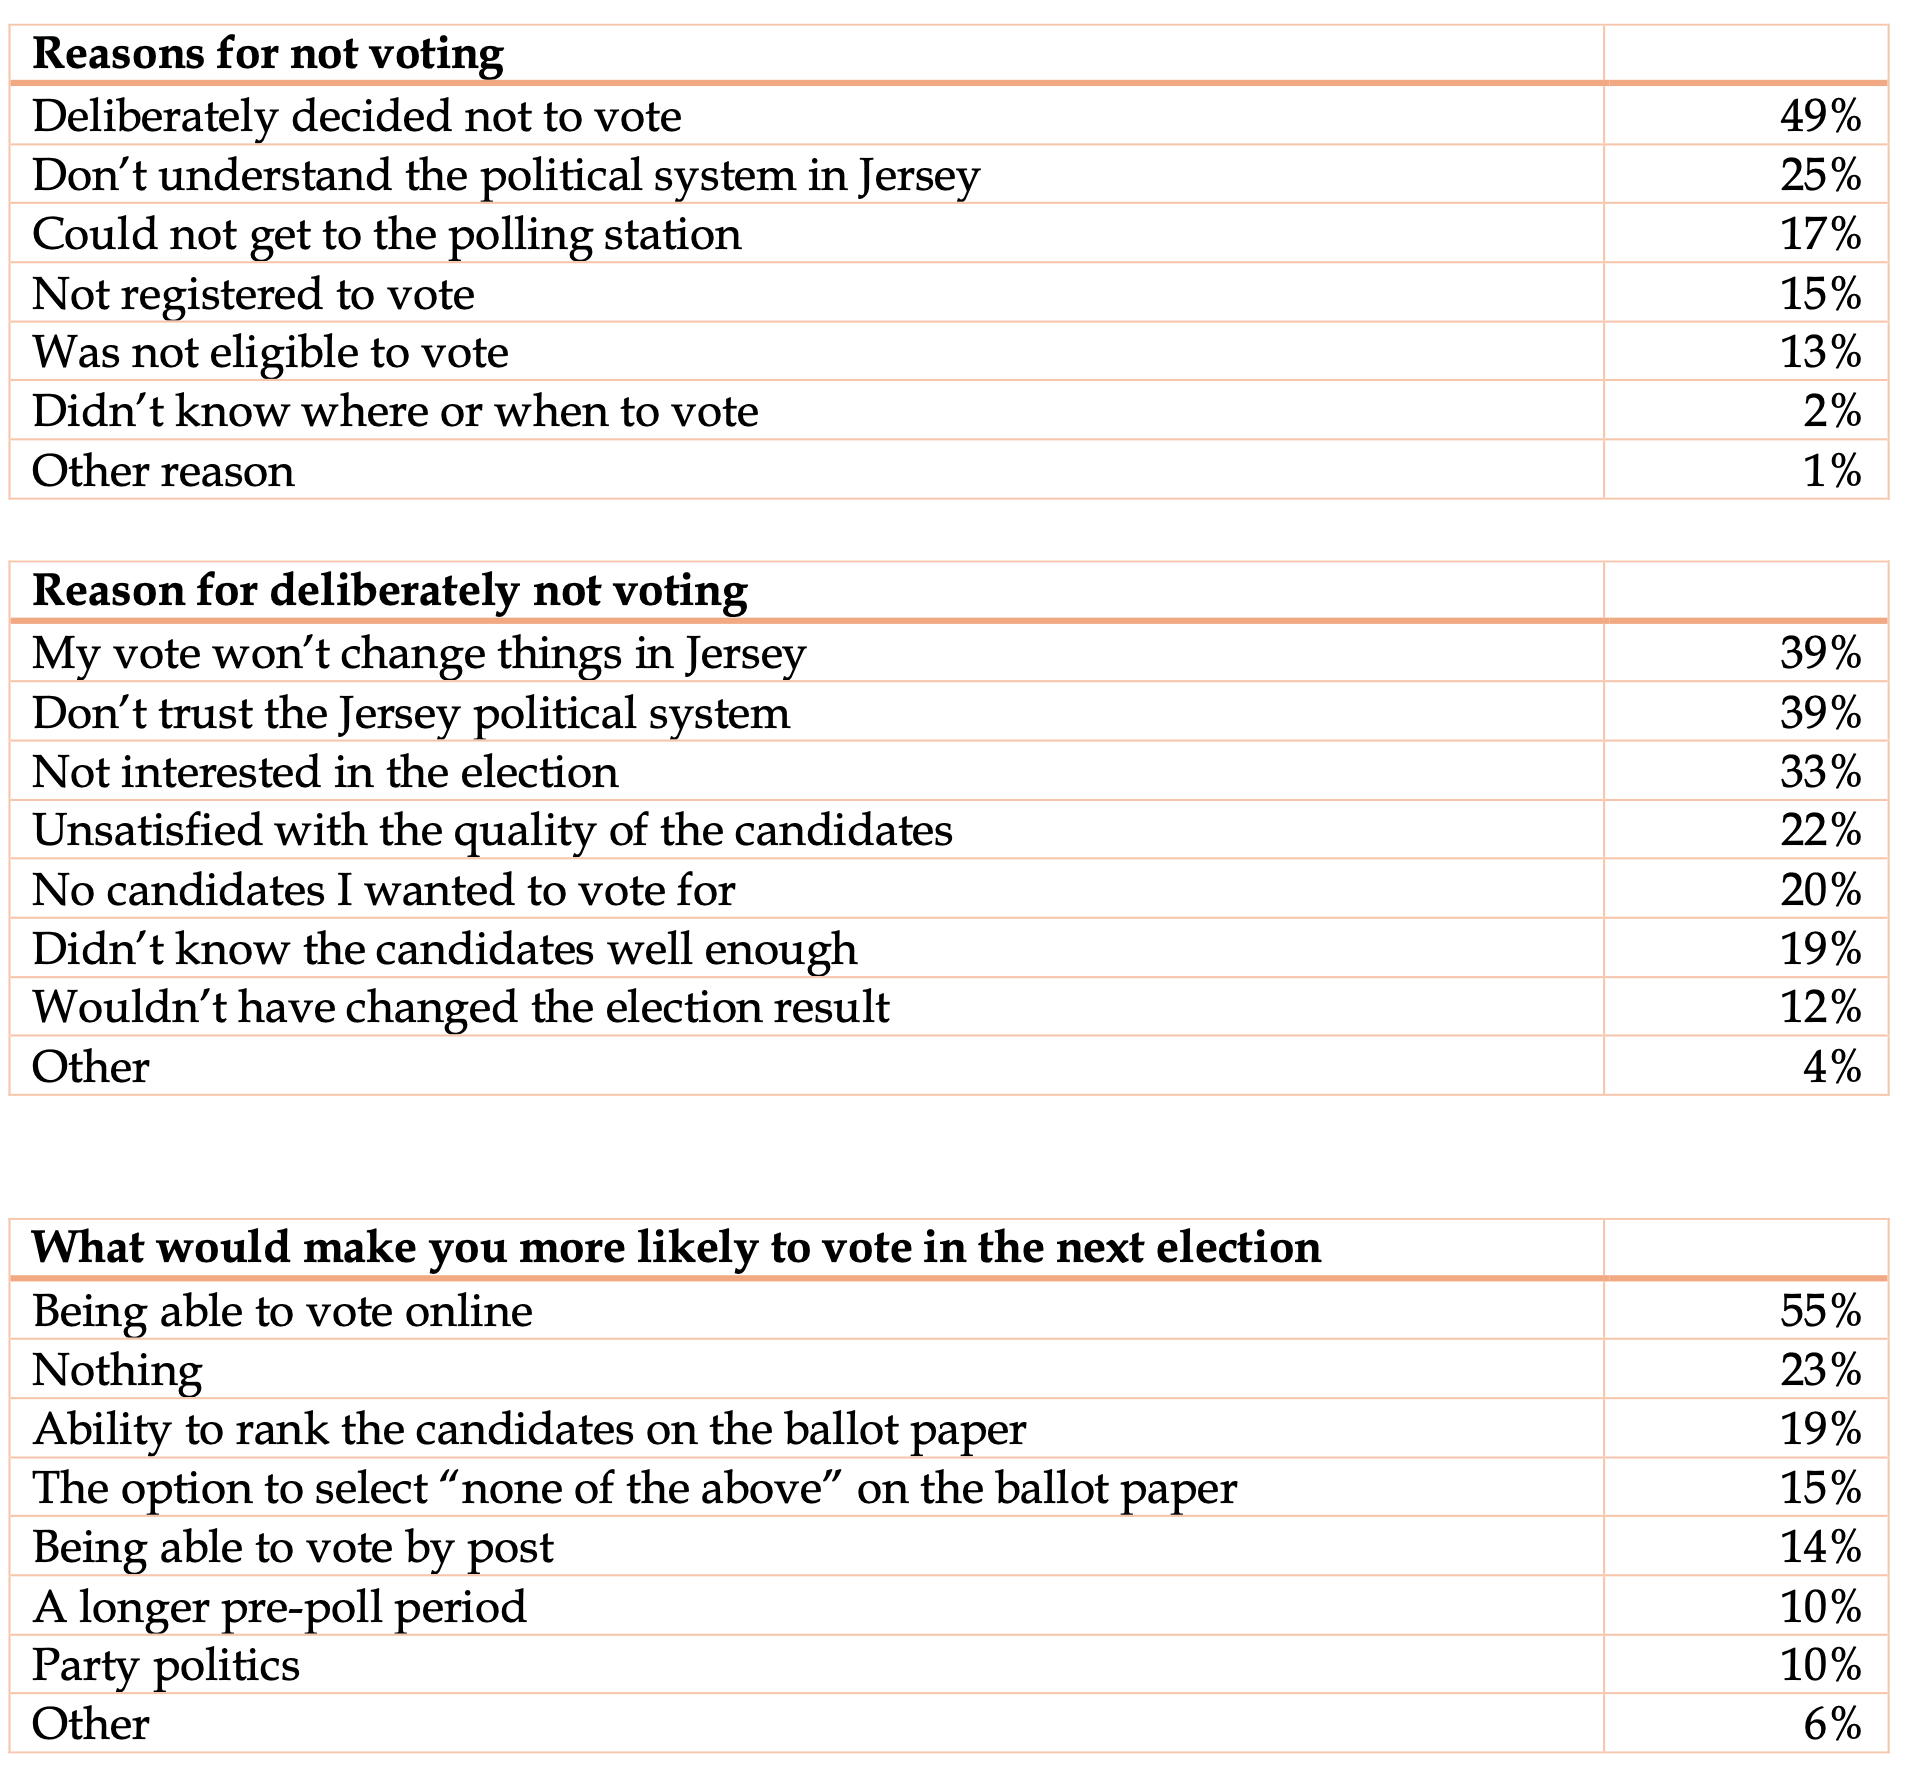
Table 9 ComRes Survey 2018
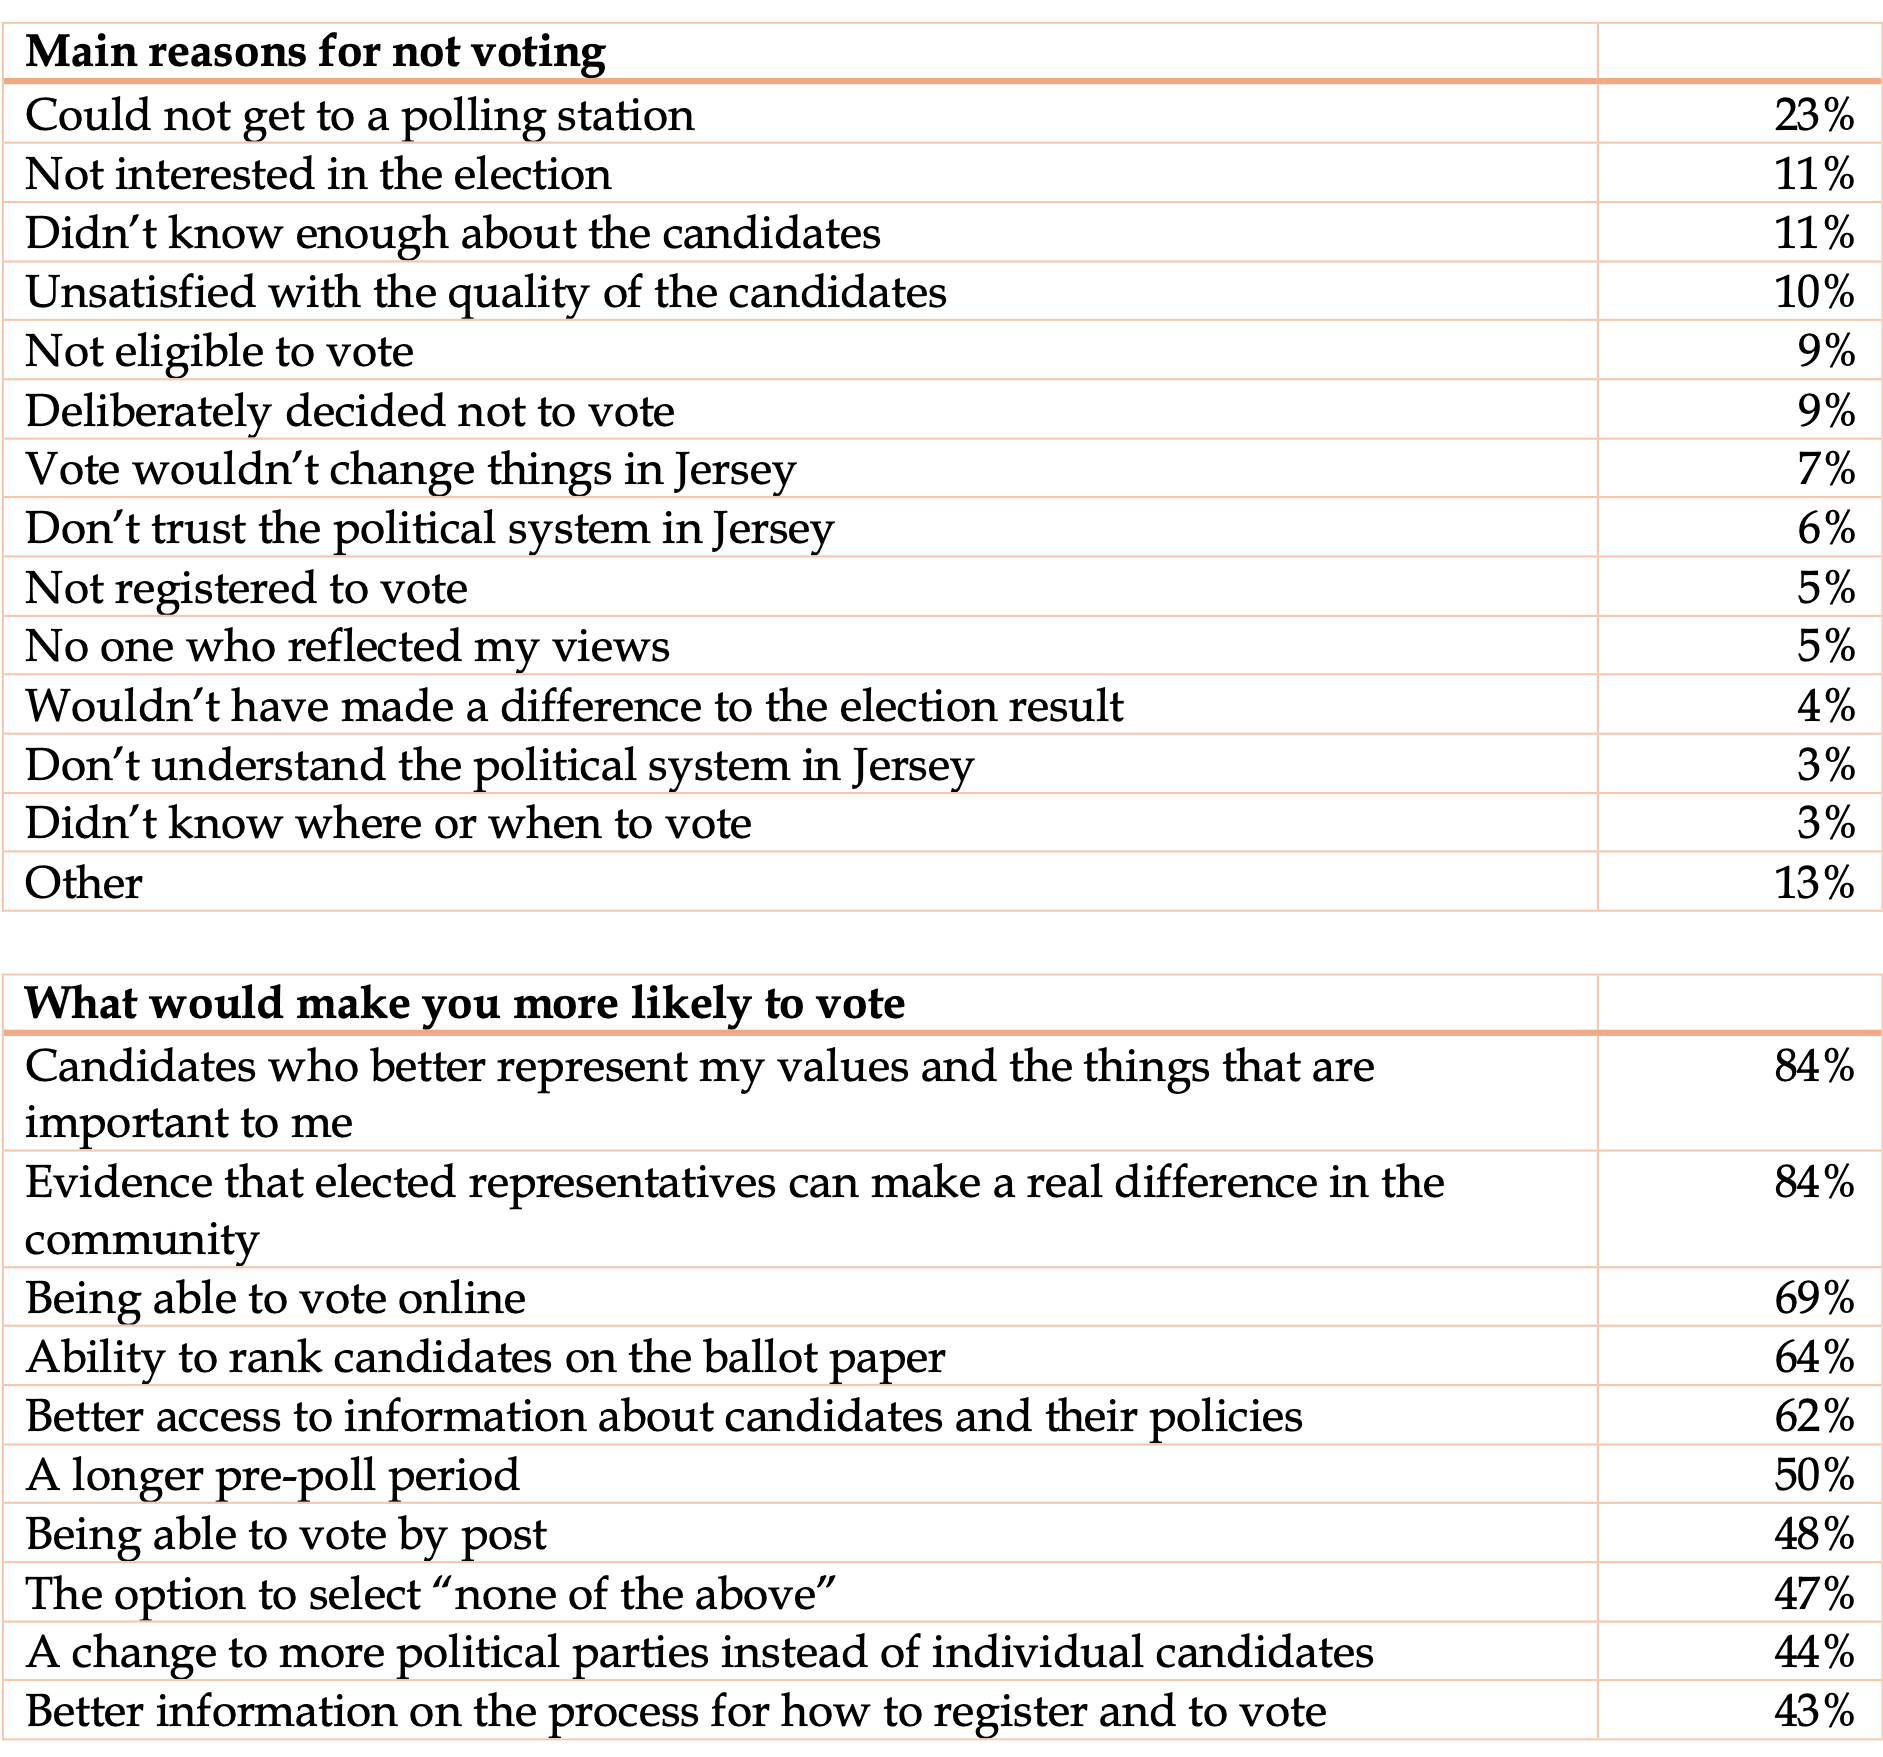
Table 10 Jersey Opinions and Lifestyle Survey Report 2022
The clear conclusion is that turnout is low because people do not want to vote, rather than because it is not easy to vote. “Wouldn’t have made a difference”, “don’t trust the political system” and “not interested” are the main reasons for not voting.
It may be argued that “being able to vote online” would significantly increase turnout – 63% and 55% said this would make them more likely to vote in the JOLS 2017 and 2018 reports. However, these figures need to be qualified. If this is presented as an option, then it is an easy one for people to answer yes to; it does not mean that they would be likely to vote online.
8. Voter registration
This paper is primarily concerned with voter turnout, but it is important not to lose sight of the related issue of voter registration for two reasons –
- As explained in Section 3 of this report, the published turnout figure depends on two variables, the number of people who voted, which is definite, and the number of people on the electoral register, which is also definite but does not accurately reflect those eligible to vote. Attempts to increase voter registration might actually have the effect of reducing the turnout percentage.
- From a public policy point of view, the objective surely is to secure the maximum possible extent of voter registration.
The Jersey Electoral Authority has stated that 75% of those who were eligible to vote in 2022 registered to be on the electoral role. Therefore, only 31% of those eligible to vote (not just registered voters) actually voted. There were significant variations between the parishes, with much higher figures in the country parishes. In St Mary, 96% of those entitled to vote registered and the turnout was 52%, so half of those entitled to vote did so. In St Helier Central, as only 57% of those entitled to vote registered and there was a 29% turnout on election day so only 17% of those entitled to vote did so.
How does the Jersey figure compare with other jurisdictions? In the UK the Electoral Commission estimates that the parliamentary register is 85% complete and the register for local government elections is 89% complete. This suggests that Jersey performs badly in respect of voter registration as well as turnout.
It is not clear what efforts are made to secure high levels of voter registration in Jersey and presumably practice differs to some extent between parishes. Examples of methods used in the UK to ensure a high level of voter registration are –
- Using Department of Work and Pensions and Council Tax information. There are tools to enable significant data matching at both national and local level.
- Door-to-door canvassing.
- Using relevant community groups.
- Campaigns such as voter registration weeks.
Voter registration is also simple and can be done online without a signature. By contrast, the Jersey form is complex, partly because of the eligibility requirements, which in the UK are simply living in the property on a particular date.
The process for removing people from the electoral register also affects the published turnout figure. If people are on the register who should not be then this artificially reduces the published turnout percentage.
In the UK, the register is continually updated using lists from coroners to record deaths, council tax data and notifications by new occupants of a property. There is also a centralised system in place which ensures that if someone registers to vote in an area then a notification is sent to the area in which they were previously registered so that they can be removed from that register. It is still practice that where no information suggests a person is no longer entitled to be registered, they may remain on the register for up to three years. However, this is increasingly less relevant as other measures that have been introduced.
In Jersey, less developed procedures and greater reliance on the three-year rule results in a higher proportion of ineligible entries on the register than in the UK, artificially lowering turnout.
The Jersey Government regularly uses social media to advise people that a single notification of a change of address is sufficient. However, the list of organisations that will be notified does not include the parish, so presumably the notification is not sufficient to remove someone from the electoral register of a parish they have moved from or add them to the register of the parish they have moved to. The Government website states that “if you're leaving Jersey for three months or more, you'll need to complete a form”. This part of the website does state that the parish will be notified, so presumably when this form is completed people are removed from the register. However, there is no mechanism to ensure that the form is completed, and it is probable that only a small fraction of people who leave the Island actually complete the form, so many remain on the register.
In the UK, the Electoral Commission publishes detailed guidance for electoral registration officers on managing the electoral register and also requires officers responsible for conducting elections to report on performance. The Commission itself publishes detailed statistics, research and analysis, much of which is relevant to Jersey. The Association of Electoral Administrators represents election officials and provides valuable help and guidance for those responsible for administering elections. There is also a mutual assistance arrangement such that experienced election officials can be brought in to help with specific elections or generally to provide support where it is needed. All election administrators use one of the established software packages to manage the register and elections.
9. New arrangements for the 2026 election
There are three significant changes relevant to voter turnout in the arrangements for the 2026 election: automatic registration of electors is being introduced, the election day will be a Sunday, and the position of senator, elected on an island-wide basis, has been reintroduced. Also, the residency requirement for eligibility to vote has been reduced from two years to one.
Automatic registration of electors
The previous section analysed the issue of voter registration and its relationship with the published turnout figures. This is being addressed by the introduction of automatic registration of electors.
In a proposition approved on 24 June 2025, the Privileges and Procedures Committee (PPC) proposed the introduction of automatic registration of electors. The PPC proposition stated that the reasons for making these changes were to –
- Make it easier for people to vote by automatically including entitled individuals on the base electoral register.
- Increase the democracy of our electoral process by removing barriers to voting.
The proposition explained how the new system would work –
Rather than completing an annual statement which lists all of those eligible to be part of the electoral register (those who have been ordinarily resident in Jersey for the last 2 years or who have been ordinarily resident in Jersey for the past 6 months but have a cumulative residency of 5 years or more), the public will be included automatically on the register if they are over 16 and meet the residency criteria. The information will come from the People Directory, a database which draws upon interactions with Revenue Jersey in relation to Social Security matters (as an employee or claimant of a benefit or pension for example), the Register of Names and Addresses and information held by CYPES for those still in full time education aged over 16. The Electoral Administrator will have a residual power to add a person to, or remove a person from, the register.
It is worth noting that the current self-declaration system as to a person’s eligibility is not verified by the Parishes, so the existing system carries a degree of risk. Furthermore, the information is gathered and input in the Autumn of each year and does not reflect any ‘movements’ in the intervening period before an election 6 or 8 months later, whereas the proposed system will allow for a more recent ‘sweep’ of the data, taking account of changes such as people leaving the Island or passing away, to ensure a more timely snapshot of the eligible electorate.
The Proposition noted that as a consequence of the new arrangements turnout could actually fall –
The new Register will include people who may have previously made a conscious decision not to make a return, either because they had no interest in voting or did not wish to be included on the list for Jury Duty. It is estimated that only 60% of statement forms are returned to Parishes. By increasing the accuracy of the register, we anticipate there will be an increase in the total number of people included. The risk is that those people remain steadfast in their refusal to engage with the democratic process and if they do not vote, our already low turnout figure will plummet even further. Conversely it could provide those who were uncertain about their eligibility status, with the necessary validation to take part in the elections. The States Greffe, through vote.je, will run a dedicated communications campaign explaining the changes, highlighting that people may now be eligible who previously may not have thought they could not participate, and everyone will be encouraged to exercise their democratic right and use their vote.
It is in fact likely that as a result of such a change turnout would be lower than it would otherwise have been. The number of people on the electoral register would be substantially higher as a proportion of the potential number, but most of the increase would be of people for whom voting is probably a low priority. The number of people who would vote in the election may therefore be higher than it otherwise would have been, but the percentage turnout would be lower.
These points can usefully be demonstrated by looking at the 2022 statistics.
JEA estimate of eligible voters 81,000
Registered voters 60,701
Voters 25,334
Voters/registered voters 41.7%
Voters/eligible voters 31.3%
Assuming that automatic registration would have increased the number of registered voters by 15,000 to 75,701 but of those additional 15,000 only 3,000 (20%) chose to vote, the figures would have been –
JEA estimate of eligible voters 81,000
Registered voters 75,701
Voters 28,334
Voters/registered voters 37.4%
Voters/eligible voters 35.0%
It will be seen that with these assumptions, the turnout rate would actually be 4.3 percentage points lower than was actually the case. The turnout percentage is the one used in international comparisons, so this change would in all probability worsen Jersey’s comparative position even if the effect was to increase the number of voters.
A Sunday election
On 1 April 2025, the States Assembly resolved that the 2026 general election will be held on Sunday 7 June. In the proposition to the Assembly the PPC observed that “our democracy is not going to function well when only a third of eligible voters are participating”. The PPC proposition stated that “in the absence of firm evidence to the contrary and, given voter apathy to date, PPC considers that a move to a Sunday election should be trialled to see if it brings more people to the polls”.
There is no evidence to support the notion that a change to Sunday voting will lead to higher turnout. The Proposition correctly observes that Sunday is the most popular day for elections. It did quote a single study done in 2004. The study noted that in 29 countries turnout was higher when elections were held on a Sunday, but when the analysis was expanded to 63 countries, the day of the election did not seem to affect participation.
Reinstatement of senators
On 11 September 2025 the States Assembly agreed the legislation to reinstate the position of senator and for it to come into effect for the 2026 election.
The motivation was to provide an island-wide mandate; the potential impact on turnout was not a significant issue. There is no way of knowing whether there will be any effect. There are only two pieces of evidence –
- As Table 2 shows, when the elections were on different days, turnout in the elections for senators was significantly higher than for deputies - by 2.4 percentage points in St Mary, 2.1 percentage points in St Helier and 8.8 percentage points in St Clement.
- When asked in the Jersey Opinions and Lifestyle Survey (JOLS) why they didn’t vote in the 2022 election, 3% said loss of the senator role.
10. Voting intentions in the 2026 election
The 2025 Jersey Opinion and Lifestyle Survey (JOLS), published on 10 December 2025, includes specific stakeholder reports, one of which is on civic engagement, including voting intentions in the 2026 election.
The results need to be seen in the context that surveys asking people whether they voted overstate the proportion who actually voted, and surveys asking about intentions to vote significantly overstate those who actually vote.
The survey covers all adults over 16 whereas published turnout figures relate to those on the electoral register. Many people entitled to vote are not on the register; it has been noted that in 2022 only 75% of those eligible to vote registered to do so.
For the 2018 election, the 2017 JOLS reported that 65% said that they would vote; the actual turnout figure was 43.4%, which equates to about 33% of those eligible to vote.
In the 2022 election, 29% of adults voted, which translates into a 42% turnout rate.
In the 2026 JOLS 51% said that they voted in the 2022 election, compared with the 29% who actually did. 60% said they intended to vote in the 2026 election. Noting that for the 2018 election, the 65% saying they would vote translated into a 43.4% turnout, the 60% suggests a turnout figure of around 42% on a comparable basis.
However, it should be noted that the introduction of automatic registration of voters will significantly increase the electorate, much of the addition being of people who are less likely to vote. As the previous section indicated, the effect of this will be to reduce the published turnout figure by perhaps 4 percentage points.
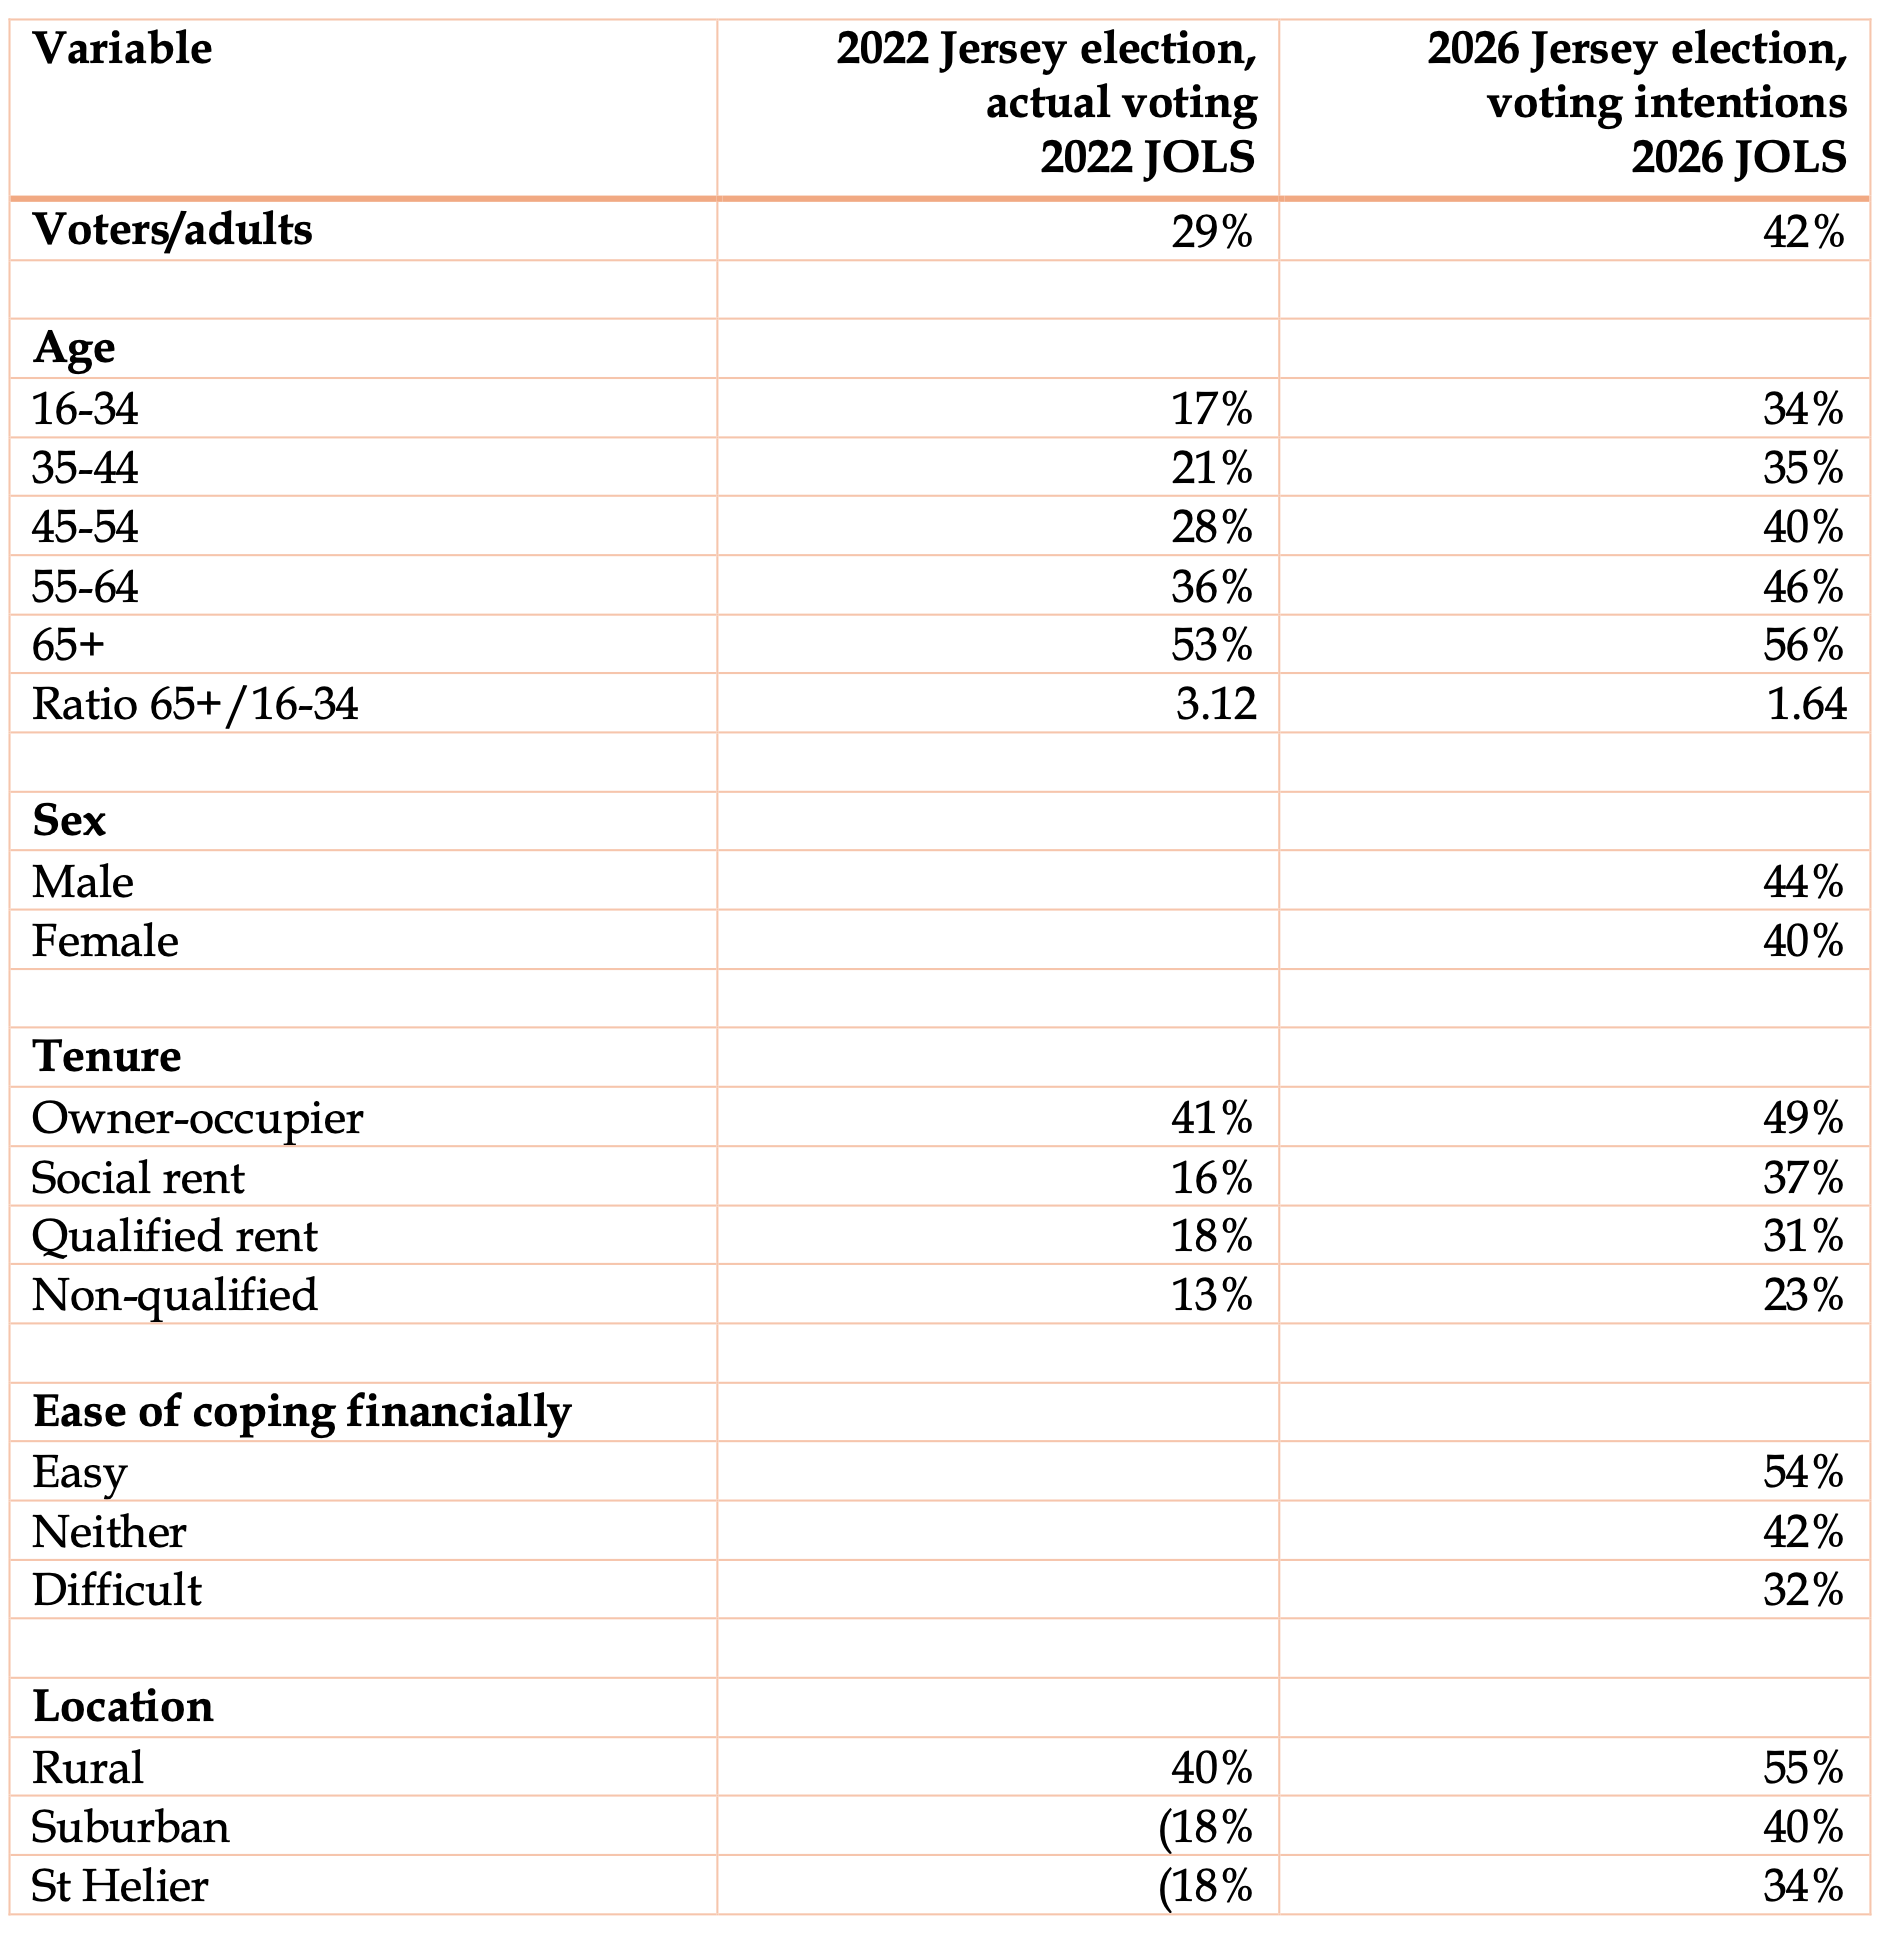
The JOLS breaks down voting intentions by characteristics. Table 11 compares these with the actual 2022 figures recorded in the 2022 JOLS. While those figures are based on the survey, the breakdown between different categories is likely to be more reliable than the total figures.
The key point remains that the elderly, owner-occupiers and those living in rural areas are more likely to vote than younger people, tenants and those living in St Helier.
At first sight, the table suggests a change compared with the 2022 election, with younger voters being significantly more likely to vote. 34% of those under 35 said they intended to vote compared with just 17% actually voting in 2022. By contrast, the proportions for the over 64s were very similar at 56% and 53%. However, it remains to be seen whether these intentions will be realised or rather whether the younger people are more likely than older people to say that they will vote but do not.
Similarly, the table suggests that those in social rented housing are significantly more likely to vote than in 2022, but again it remains to be seen if this translates into actual voting.
Table 11 Intention to vote in the 2026 election
11. Measures to improve voter registration and turnout
Low turnout and voter registration largely reflect disinterest in or dissatisfaction with the political system in Jersey, which is largely outside the scope of his paper. Accordingly, making it easier for people to register and to vote will have only a modest effect on turnout while the substantive issues remain. Also, while improvements can be made within the present law, some relatively minor legal changes would be helpful.
Voter registration
The previous section noted the intention to introduce automatic registration of electors. Although the necessary legislation has been approved registration forms have been issued in the usual way, so it is not clear what system will actually be used in the election.
It is useful here to compare Jersey’s form (Appendix 2) with Guernsey’s (Appendix 3). Jersey’s form has 900 words; Guernsey’s has 100. Jersey's form is user-unfriendly bearing in mind that the problem is not people registering who should not but rather people who should be registering who choose not to.
There is a welcome emphasis in Jersey on inclusion, but in respect of voting this does not apply to newcomers to the Island, given the requirement to have been resident in the Island for two years (now reduced to one year) before being able to vote. There is no such requirement in the UK - all that is required is to be resident on a particular day. Guernsey also has residence requirements although not as complex as those in Jersey. The form would be much simpler if the UK practice was adopted, or if there is a wish to have a residency requirement then perhaps it could be limited to a single one such as residence in the past six months.
The guidance issued by the Electoral Commission in the UK could also be drawn on and, as much as possible, applied to Jersey.
Recommendation 5 of the CPA Observer Mission is relevant –
Consideration should be given to performing an audit of the voter registration system for accuracy, inclusivity and data security.
A single electoral register
However, improving voter registration will never be fully effective as long as there are 12 separate systems that operate on rather old-fashioned systems rather than tried and tested election software. Information is not fully shared between parishes, which probably means that people can be on two registers at the same time. There are huge economies of scale from having a centralised system for such a small population. This can probably happen within the existing legal requirement that parishes maintain electoral registers, but it would be sensible for the law to be amended so as to allow parishes to delegate this responsibility to other parishes or to the JEA.
Along with addressing this problem a single register would also help deal with the failure to use methods common in the UK, that results, for instance, in Jersey still keeping people on the register for up to three years after they have failed to return a form. UK practice again is a suitable starting point for addressing this but it cannot be done effectively as long as there are 12 separate registers.
Polling stations
It is probably the case that increasing the number, or improving the location, of polling stations would make only a modest difference to turnout but nevertheless it is something which should be done because there will be a modest benefit, and also it is simply appropriate to do so. The CPA Observer Mission commented: “There was a significant disparity in the number of registered voters allocated to each polling station, with numbers ranging from 1,370 to 8,030.” It recommended –
The number of voters per polling station should be reviewed, to ensure polling stations are in close proximity to voters’ residences and/or easily accessible via public transport, and to ensure that polling stations are manageable if many voters turn out on Election Day.
This can be done within the present law, but it would be helpful for the parishes collectively to agree on some criteria.
It is also worth considering the Guernsey practice of allowing people to vote at any polling station, although this partially reflects having a single island-wide constituency.
Postal voting
The easiest quick win to increase turnout is to increase postal voting. In Jersey, only 8% of people voted by post, whereas in the UK the typical figure is 20% and in the most recent Guernsey election it was about 40%.
It was only in the most recent Jersey election that universal postal voting was permitted, as opposed to voters having to demonstrate an inability to post in person. It was not handled well. Voters were sent a form for postal voting, which some assumed was a form they had to complete. Some duly did so and took the form to parish halls even though they did not want a postal vote - a point made in the CPA Observer Mission report. Best practice, for example in the UK, is for the voter registration form simply to ask whether people want a postal vote.
Administration of elections
The CPA Observer Mission report noted that –
The administration of the electoral process is fragmented. Historically, the following institutions were involved: the Parishes at the local level, and the Judicial Greffe and the States Greffe at the central level.
After noting that the Jersey Electoral Authority was added to the list of organisations it went on to recommend –
To improve the general efficiency and transparency of the administration of elections, consideration could be given to reviewing the different roles, processes, coordination opportunities, and necessary resources for the implementation of the elections.
That the 2022 election ran smoothly was despite the arrangements, not because of them. The CPA Observer Mission commented that it was not acceptable for the JEA to be set up immediately before the election, not to be properly resourced and that its role in the election was not clear.
Appendix 1 – Jersey/Guernsey comparison
Given that Guernsey’s turnout is significantly higher than that of Jersey, it is appropriate to explore the reasons for this in detail. Table 12 gives key data.
Table 12 Jersey and Guernsey – key data
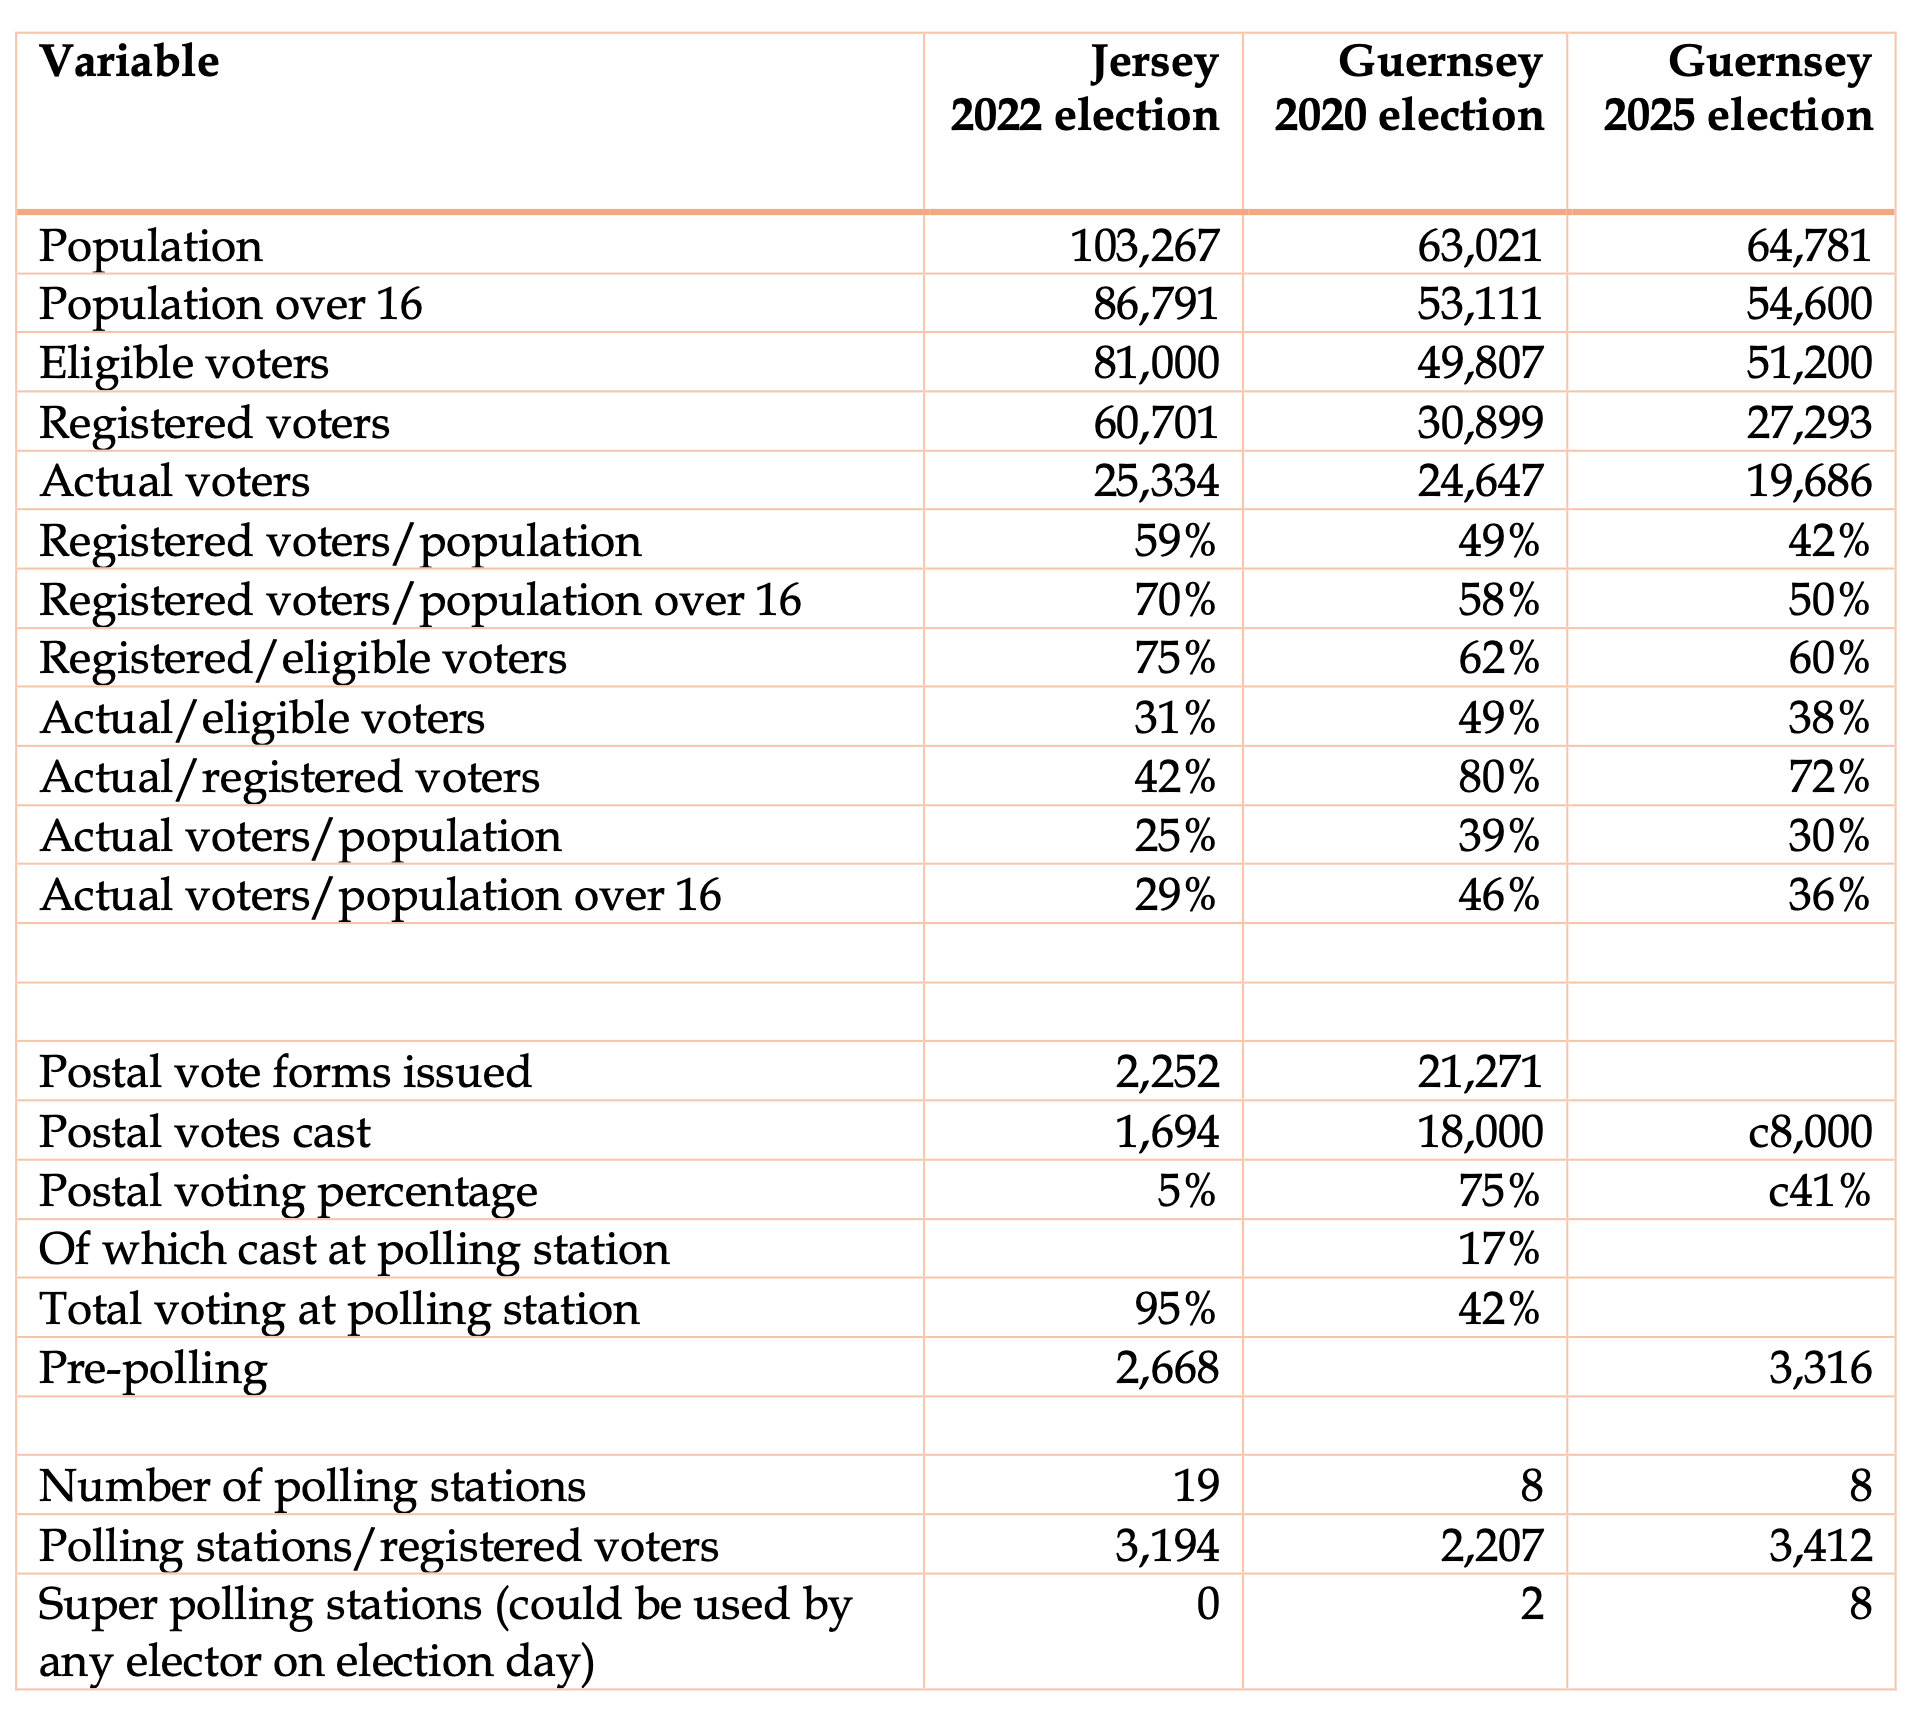
Note: The 2020 Guernsey figures are taken from official data. Comprehensive statistics on the 2025 election have not been published and there is also uncertainty about the population figure. Accordingly, the percentages have a margin of error.
The significant differences between the two Guernsey elections are apparent.
The 2020 election
It is necessary to recognise the special circumstances surrounding Guernsey’s 2020 election –
- The election was held during the pandemic. Although activities in Guernsey were almost back to normal, some people were still concerned to minimise activities that might cause them to catch Covid.
- There had been a radical change in the electoral system, the previous system of seven constituencies being replaced by a single Island-wide vote for 38 seats. This was contested by 119 candidates. Clearly such an arrangement was likely to encourage people to vote at home when they could consult the booklet that gave the details of and manifestoes of all the candidates.
The following analysis draws on a Billet d’Etat dated 16 June 2021 by the States Assembly and Constitution Committee (SACC). This comprised recommendations to the States of Deliberation and two reports –
- Report of the Commonwealth Parliamentary Association Observer Mission.
- Report of the Registrar-General of Electors.
Voter registration
Guernsey has recognised that electoral registration is unsatisfactory. A new electoral roll is established for each election,which means voters have had to register to vote prior to each General Election. This has required the States of Guernsey to publicise extensively the need to register, with significant efforts being made to increase registration for the 2020 election.
31,301 voters registered, of whom 30,899 were eligible to vote in the General Election, the remainder still being aged 15 on 7 October and not able to vote until their 16 th birthdays.
This was a modest improvement on the 2016 numbers, but only about 62% of those eligible to do so actually registered to vote, meaning that there were still potentially about 10,000 eligible residents who did not register.
The CPA Observer Mission recommended -
Formal processes of voter registration could be introduced as part of an ongoing rolling process of registration. Voter registration could be done as part of any annual engagement that residents have with the state, such as filing tax returns.
Postal voting
A target of 30% of votes to be postal votes had been established. In pursuit of this, the Election Team heavily promoted the option of postal voting. The Report of the Registrar-General of Electors commented –
Perhaps as a result of this promotion, the 2020 General Election saw a much bigger take-up of postal votes than in previous Elections, with 69% of those on the Electoral Roll opting to register for a postal vote. This meant that 21,271 postal votes were issued to addresses both within and outside of Guernsey. Completed ballot papers, accompanied by a Declaration of Identity, could be returned by post or placed into a ballot box at a polling station. The majority were returned by post. Approximately 75% of all votes cast were postal votes, meaning that the 30% target was exceeded by a considerable margin.
The Registrar-General commented on the reasons for this -
There were a number of reasons cited for the preference for postal voting. The fact that each voter was able to cast up to 38 votes was given by some as a reason for their choice, as they were able to consider their votes at their leisure in the comfort of their own homes. Covid-19 and uncertainty about the ability to attend a polling station was another relevant factor, as was the requirement for self-isolation for anyone returning to the island from elsewhere. This last factor was recognised by the States of Deliberation, which passed Regulations which meant that persons finding themselves having to self-isolate were able to register for a postal vote after the deadline for doing so had passed. The necessity of doing this was demonstrated by the fact that a handful of voters needed to rely on these Regulations.
The preparation of postal vote packs was done by the provider of the ballot papers, UK company UK Engage (UKE), rather than, as had been the case in the past, manually by the Election Team.
Pre-polling and polling stations
Guernsey introduced pre-polling for the first time and also super polling stations at which any voter could vote. The Registrar-General explained –
A higher than usual voter turnout was anticipated as a result of moving to island-wide voting. With each voter able to cast up to 38 votes, meaning that completing a ballot paper would take longer than previously, it was necessary to take steps to ensure that voters did not have to stand in long queues awaiting their turn to enter a polling booth.
Consequently, pre-polling days were used for the first time and the concept of super polling stations was introduced. Super polling stations could be used by voters from any parish, as distinct from parish polling stations which were only available to residents of the parish in question.
There were 14 polling stations, six of which had under 400 voters each. The SACC recommended that it –
should consider consolidating the polling stations, with a view to reducing the number and/or opening hours of the Parish polling stations and increasing the number of super polling stations.
Permanent election body
The CPA Observer Mission made the following recommendation –
A permanent dedicated elections body should be constituted so that institutional knowledge and expertise can be embedded in the Guernsey electoral system. This body could provide continuous electoral oversight, including oversight of candidate and voter registration, political parties and campaign finance.
The SACC recommended that it should investigate the creation of an independent body to advise on and oversee future elections, and that the options for a pan-Island body should be considered -
The Committee will consider the type of body that might be appropriate for Guernsey, undertake consultation with existing stakeholders and consider whether there might be options for a pan-Island solution and consult with Jersey, Alderney and Sark accordingly. It will also research the practicalities, costs and timeframes for creating such a body.
The 2025 election
Electoral registration and turnout fell substantially compared with 2020 –
- The number of registered voters fell by 12% from 30,899 to 27,292.
- The number of voters fell by 20% from 24,647 to 19,686.
- The published turnout figure fell from 80% to 72%.
- The percentage of people aged 16 and who were over fell from 46% to 36%.
There is no analysis of the reasons for these significant changes. The report of the Commonwealth Parliamentary Association Observer Mission does not analyse this point. It made one significant recommendation –
Review the merits of establishing a permanent electoral roll using relevant official data sources, to increase the number of eligible voters included on the electoral roll. This roll should be updated on a continuous basis to reflect newly eligible individuals, deaths, and changes in residency status.
Reconciling the Jersey and Guernsey turnout figures
Given the full description of the electoral registration system in Guernsey, it is possible to explain why a comparison of the crude turnout figures for the two islands is misleading.
Jersey adopts the normal UK system of rolling registration. Once people are on the register, they stay on it unless there is firm evidence that they are no longer at the address, or they have not responded to the annual canvass for three years. This means that many people on the register are unable to vote (because they have died) or are much less likely to vote because while still being on the register and therefore legally able to vote they are no longer at the same address. Registers compiled on this basis are therefore inflated, and the turnout figure is artificially deflated. For example, if 5,000 of the people on the Jersey register came into these categories, the electorate would have been 55,701 and the turnout would have been 45.5% not 41.7%. The processes for removing people from the register are less well developed in Jersey than in the UK, which means that the register is artificially inflated to a greater extent and turnout accordingly deflated.
Guernsey’s practice is to compile a new register for each election, the closing date usually being three months before polling day. Compared with the Jersey system, this means that the register has fewer people unable or unwilling to vote. In Jersey, the number of registered voters was equal to 70% of the total population over 16; in Guernsey, the figure was 58% in 2020 and 50% in 2025. If Jersey adopted the Guernsey system its turnout would have been 50.1% not 41.7%. This is not to suggest that Jersey should adopt the Guernsey system. However, it does mean that comparisons between Jersey and Guernsey should take account of this point – and also the point made earlier that the more effective the system for cleaning registers of people who should not be on them, the higher the published turnout will be.
Appendix 2 – Jersey electoral registration form
Appendix 2 – Jersey electoral registration form


Appendix 3 – Guernsey electoral registration form

References and resources
Composition of the States Assembly
Report of the review panel on the machinery of government in Jersey (the Clothier report) (2000). The review panel was established by the States Assembly to review all aspects of the machinery of government in Jersey. The authoritative report is the only substantive external review of the machinery of government. Most of its recommendations were not implemented.
Electoral reform 2020 (P.126/2019) - Report lodged on 23rd December 2019 by the Privileges and Procedures Committee. This is the substantive report on changes to the composition of the States Assembly in 2022. It contains much useful analysis. However, the proposition was defeated; a new proposition Composition and Election of the States: Proposed Changes (P.139/2020), without the detailed report and with a significant amendment, was approved.
Jersey elections
Jersey General Election 2018, CPA BIMR election observation mission final report.
States of Jersey General Election June 2022, CPA BIMR Election Observation Mission final report.
Comres, Voter Engagement Research for the States of Jersey, November 2018.
Jersey Opinions and Lifestyle Survey Report 2017.
Jersey Opinions and Lifestyle Survey Report 2018.
Jersey Opinions and Lifestyle Survey Report 2022.
Jersey Opinions and Lifestyle Survey Report 2025 Stakeholder Reports.
Guernsey
John Reardon and Christopher Pich. 2021. The strangest election in the world? The October 2020 general election in Guernsey. Small States & Territories, 4(1).
Guernsey General Election October 2020, CPA BIMR Election Observation Mission final report.
Report of the Registrar-General of Electors on the 2020 Guernsey election.
Guernsey General Election June 2025, CPA BIMR Election Observation Mission final report.
UK and international
Electoral Commission Guidance: Electoral Registration Officers.
Ipsos How Britain voted in the 2024 election.
Elise Uberoi, 2023, Turnout at elections. House of Commons Library.
