Policy Brief
Economic trends
Introduction
This Brief provides a summary of the key data on trends in the Jersey economy, in particular the major variables – economic growth, retail prices and earnings. It also summarises the analysis from the Government’s Fiscal Policy Panel (FPP), which includes forecasts for the next three years.
Summary
- Financial and insurance services account for 38.5% of Jersey’s economy.
- Jersey’s economy decreased by 0.7% in 2024. The FPP forecast is for growth of 0.4% in 2025 and 0.9% in 2026.
- Retail prices increased by 2.8% in the year to September 2025. The FPP’s May 2025 forecast is that the underlying rate of inflation will be 3.7% in 2025 and 2026.
- Average earnings increased by 4.5% in the year to June 2025. The FPP’s May 2025 forecast is for an increase of 4.3% in 2025 and 2026.
- The all-sector business activity indicator in September 2025 was moderately negative with a balance of -12 percentage points, that is 12% more businesses percent were more negative than positive
- The FPP’s May 2025 forecast for house prices is no change in 2025 and increases of 2% in 2026 and 2027.
Structure of the economy
The annual report Measuring Jersey’s Economy GDP and GVA – 2024 was published on 3 October 2025. Table 1 shows a breakdown of Gross Value Added (GVA) by sector in 2024.
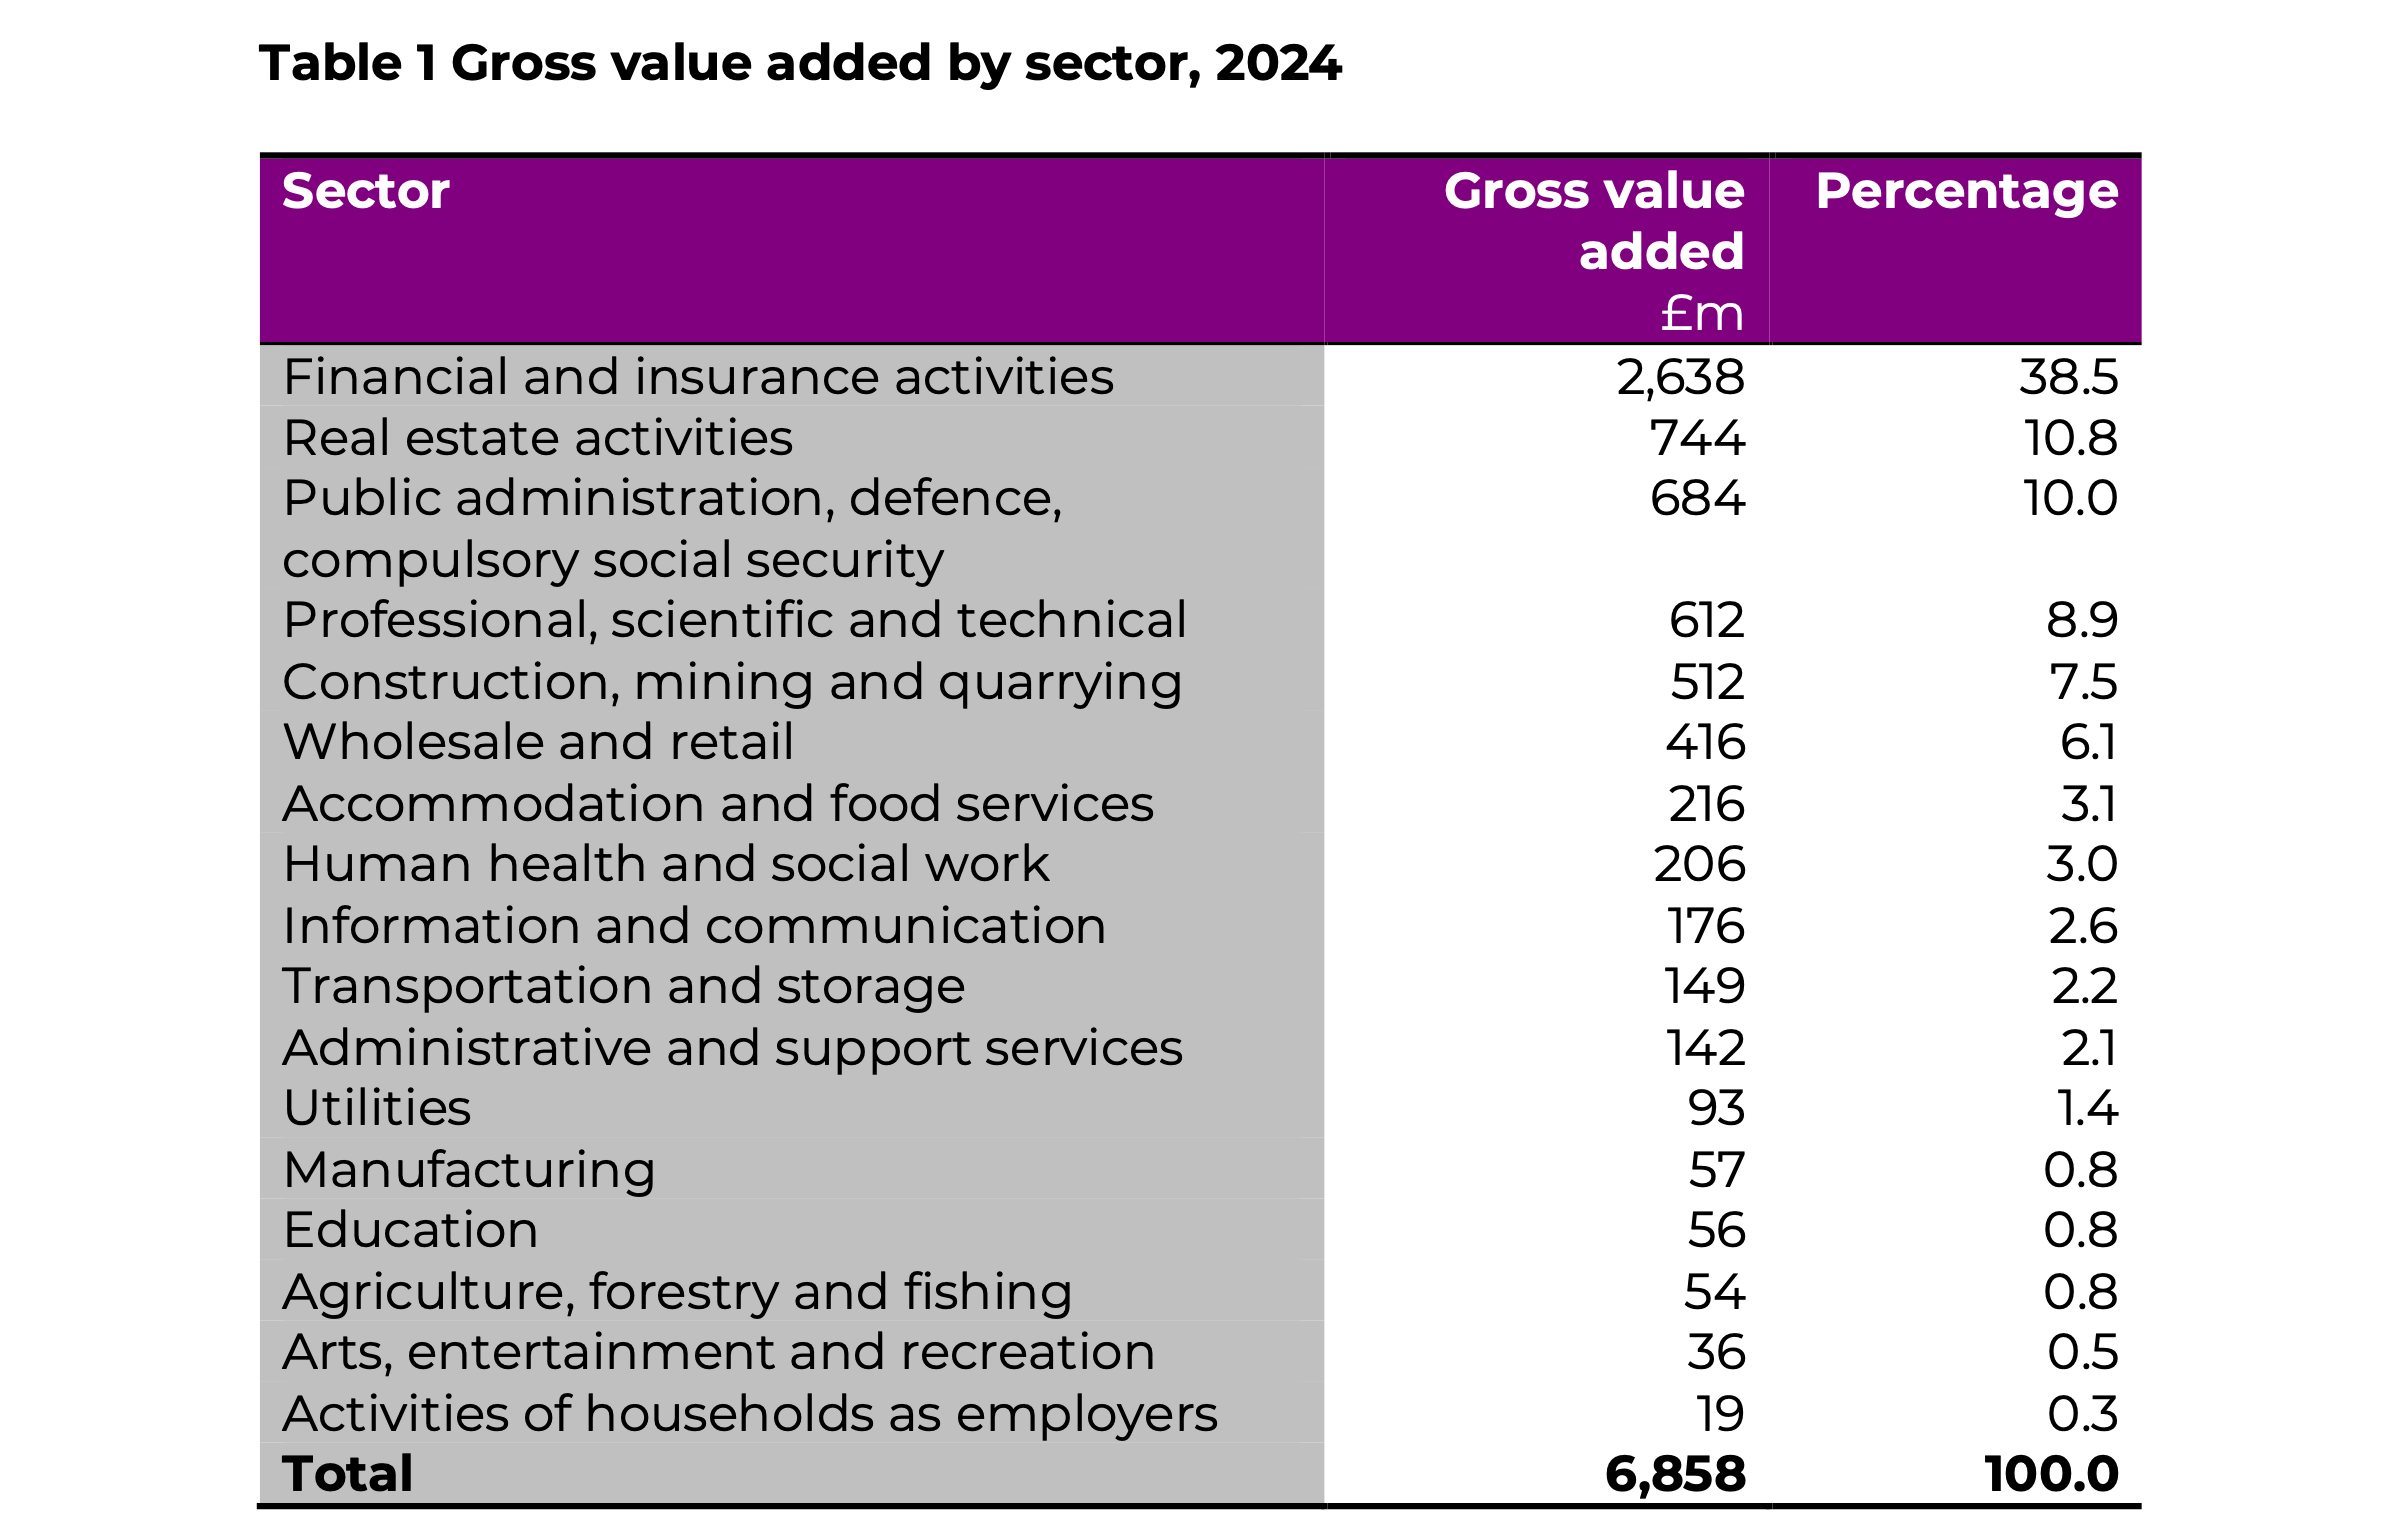
The breakdown is presented using the revised 2007 Standard Industrial Classification. The report notes that whilst most of these sectors are self-explanatory the following are worthy of particular comment –
- Financial and insurance activities includes a number of sub-sectors such as banking, trust and company administration as well as other financial service providers. It does not include legal and accounting services which have been traditionally included within the Jersey “Financial Services” GVA figures. These sub-sectors are now included under the “professional, scientific and technical activities” sector making international comparisons easier.
- Real estate activities includes rental income of private households which was previously presented separately. This includes both rental income earned by private households as well as owner-occupied imputed rental costs (a notional figure of the rent that would be payable on owner-occupied properties), which represents 57% of the GVA in this sector.
- Public administration includes the Government of Jersey, non-ministerial departments and the twelve Parishes. It does not include trading entities such as the Ports of Jersey or Jersey Car Parks, which are classified under transport and storage.
- Professional, scientific and technical activities includes (as mentioned above) the activities of legal and accounting services.
The key statistics on Gross Domestic Product (GDP) are –
- GDP decreased by 0.7% in real terms compared with 2023.
- GDP was £6,859 million.
- GDP per head of population decreased in real terms by 1.3% compared with 2023.
- GDP per head of population was £65,800.
A sectoral breakdown of Gross Value Added (GVA) shows –
- The annual decrease in overall GDP was driven by the financial and insurance activities sector, particularly as a result of decreased net interest income in the monetary intermediation (banking) sub-sector compared to 2023.
- Excluding the financial and insurance activities sector, the GVA for the rest of the economy increased in real terms by 3.1%.
Labour productivity measured as GVA per full-time equivalent worker, decreased by 1.2% in real terms in 2024. This decrease was again driven by decreased profits in the financial and insurances activities sector. Excluding finance, overall productivity across the rest of the economy increased by 2.3%.
Economic growth
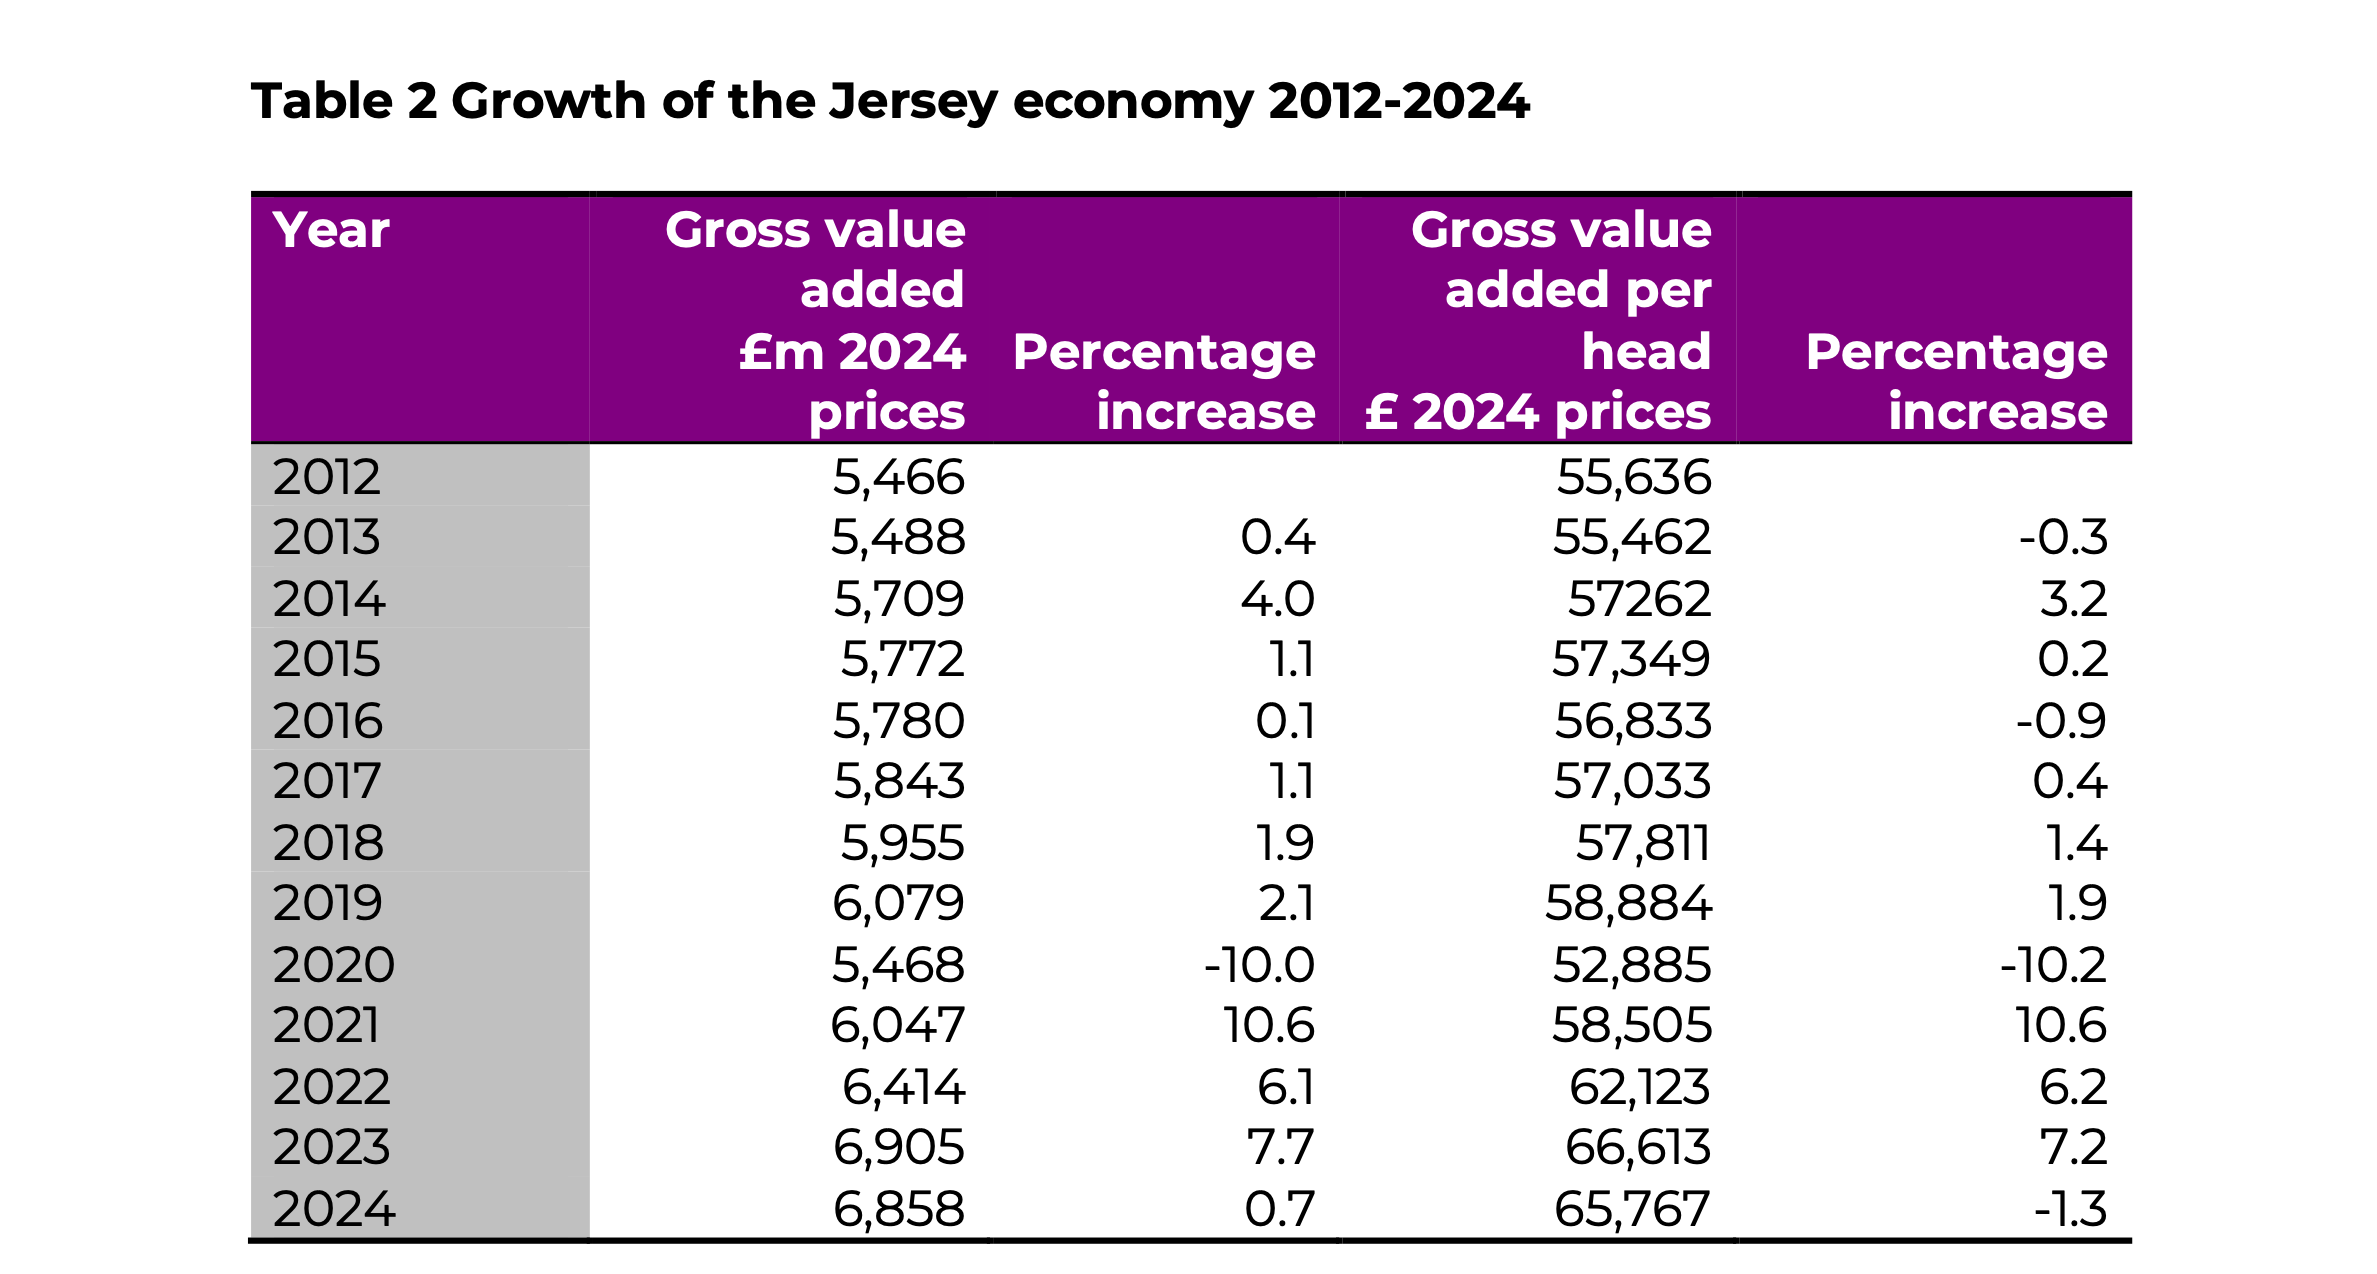
The report gives links to detailed statistical tables, which enable the longer run performance of the economy to be analysed. The economy grew rapidly in the late 1990s and then was fairly stagnant until 2007. By 2013 the economy had shrunk by 15% and, given the increase in population, GVA per head had fallen by over 20%. There was then a steady recovery until 2020 when the pandemic caused a 10% reduction in the size of the economy. This was reversed in 2021 and strong growth of 6.2% was recorded in 2022 and 2023 before the downturn in 2024. It was only in 2022 that GVA in real terms exceeded the 2000 figure. However, given the increase in population real GVA per head in 2024 was 10% lower than in 2000.
Table 2 summarises these trends. The figures are taken from tables that can be accessed from the 2024 report.
Retail prices and earnings
Statistics Jersey publishes quarterly retail price reports.
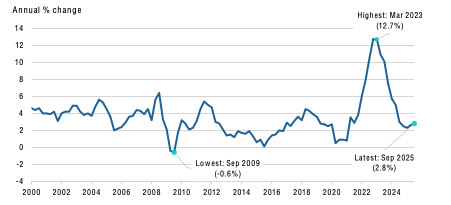
On 29 October 2025, the Government released the Jersey Retail Prices Index September 2025 report. Key points –
- the All-Items Retail Prices Index (RPI) increased by 2.8% in the year to September 2025 to stand at 240.3 (June 2000 = 100)
- the increase in the RPI was 0.2 percentage points more than that to June 2025 (2.6%) and 0.2 percentage points less than a year ago (3.0% in September 2024)
- motoring which includes motor vehicles, sundry motoring costs, petrol, diesel and motor insurance, and leisure services which includes entertainment, sport and leisure fees, and off-Island holidays were the price groups that made the largest contributions to the annual rate of inflation, both contributing +0.5 percentage points to the rate
- prices in the housing group fell over the 12 months to September 2025
- RPI(Y), which measures underlying inflation, increased by 4.1%
- RPI(X), which excludes mortgage interest payments, increased by 4.0%
- RPI Pensioners increased by 4.1%
- RPI Low Income increased by 4.0%
- annual changes in RPI(Y), RPI Pensioners and RPI Low Income were 0.1 to 0.3 percentage points higher than those in June 2025
- the rate of inflation in Jersey, as measured by the RPI, was 1.3 percentage points lower than the UK CPIH, which is the broadly comparable headline rate of inflation for the UK.
The following graph of Jersey’s RPI is reproduced from the report.
Figures on average earnings are published for June each year. Index of average earnings June 2025 was published on 22 August 2025.
The summary is set out below –
In June 2025:
- average earnings per full-time equivalent employee (FTE) were 4.5% higher than in June 2024
- after adjusting for inflation (the headline rate of inflation in Jersey in June 2024 was 2.6%), average earnings increased in real terms by 1.4%
- over the last 10 years, average earnings have decreased in real terms by 1.4%
- over the last 12 months:
- average earnings in the private sector increased by 4.5% in nominal terms (before adjusting for inflation) and in real terms increased by 1.9%
- average earnings in the public sector increased by 4.8% in nominal terms and in real terms increased by 2.2%
- on a sectoral basis:
- the construction and quarrying sector was the only sector to record a decrease in average earnings (decreased 0.2% on an annual basis)
- the agriculture and fishing sector saw the highest annual increase, up 13.4% on an annual basis; this was driven by increased hours worked and the increase in the minimum wage
- median average earnings of full-time equivalent employees was £890 a week
- mean average earnings of full-time equivalent employees was £1,040 a week
Business trends
On 22 October 2025 Statistic Jersey published the Jersey Business Tendency Survey , September 2025. The key points were –
- The all-sector business activity indicator was moderately negative with a balance of -12 percentage points, that is 12% more businesses percent were negative than positive.
- The expectation for future business activity was neutral with a balance of +9 percentage points.
- Labour and non-labour costs were reported as increasing by almost half of all businesses, resulting in balances of +36 percentage points and +29 percentage points respectively.
- The main factors limiting business activity were cited as being staff and/or skills shortage (54%), lack of demand (33%) and regulation (31%).
- In respect of sectoral differences
- In the finance sector current conditions were mostly neutral but firms expect an increase in activity and profitability over the next three months.
- In the non-finance sector cost pressures are more pronounced, and firms expect continued increase in input costs and prices and decreases in profitability.
Fiscal Policy Panel analysis and forecast
Statistics Jersey publishes statistics. Analysis of the statistics and forecasts for the future are made by Jersey’s Fiscal Policy Panel, a group of economists who provide the Government with independent advice on trends in the economy and the economic outlook. The Panel published its Annual Report on 3 November 2025. Its analysis of economic developments made the following points –
- The global outlook remains weak and uncertain. The IMF’s World Economic Outlook highlights that growth is expected to stay below pre-pandemic norms and core inflation is still above target in several economies, including the UK. Financial conditions are tighter than in recent years and geopolitical risks remain elevated. For a small, open, and import-dependent economy, dependent on global capital flows, these factors argue for caution and for preserving room to respond if conditions deteriorate.
- Jersey’s economy contracted by 0.7% in 2024 as banking profits fell back with the reduction in interest rates, driving a -6.2% contraction in financial services. Outside of financial services, the public sector grew by 8.5% and non-finance grew by 3.3%.
- Underlying inflationary pressures are increasing. Whilst inflation has fallen from its 2023 peak, underlying inflation has since remained above normal levels, the gap with the UK has widened and headline Jersey inflation is now edging upwards. Domestically generated price increases, particularly in services, are a concern and consistent with wage growth outpacing productivity in parts of the economy.
- The labour market remains tight, and capacity is constrained. Recruitment continues to be difficult in some sectors, which adds to cost pressures and may limit growth in output.
- Housing market activity has slowed further. House prices fell by 8.2% in 2024, the largest annual fall since 1986, and transactions remain low, although there are tentative signs of a pickup as interest rates continue to fall. Weaker turnover and lower prices weigh on construction and related activity, while also easing some affordability pressures for prospective buyers. Housing market activity has remained subdued in 2025.
Table 3 shows the Panel’s forecasts for the main economic variables, published in its May 2025 report.
Table 3 Key economic variables, rate of change %
.
